Airflow
See the air.
Every picture on this page comes out of the same simulations as our numbers: a Model 3 at 80 mph on a 17.2 million cell mesh, with the swirling wake resolved in time. Spin the car, take the spoiler on and off, and see where the pressure lands.
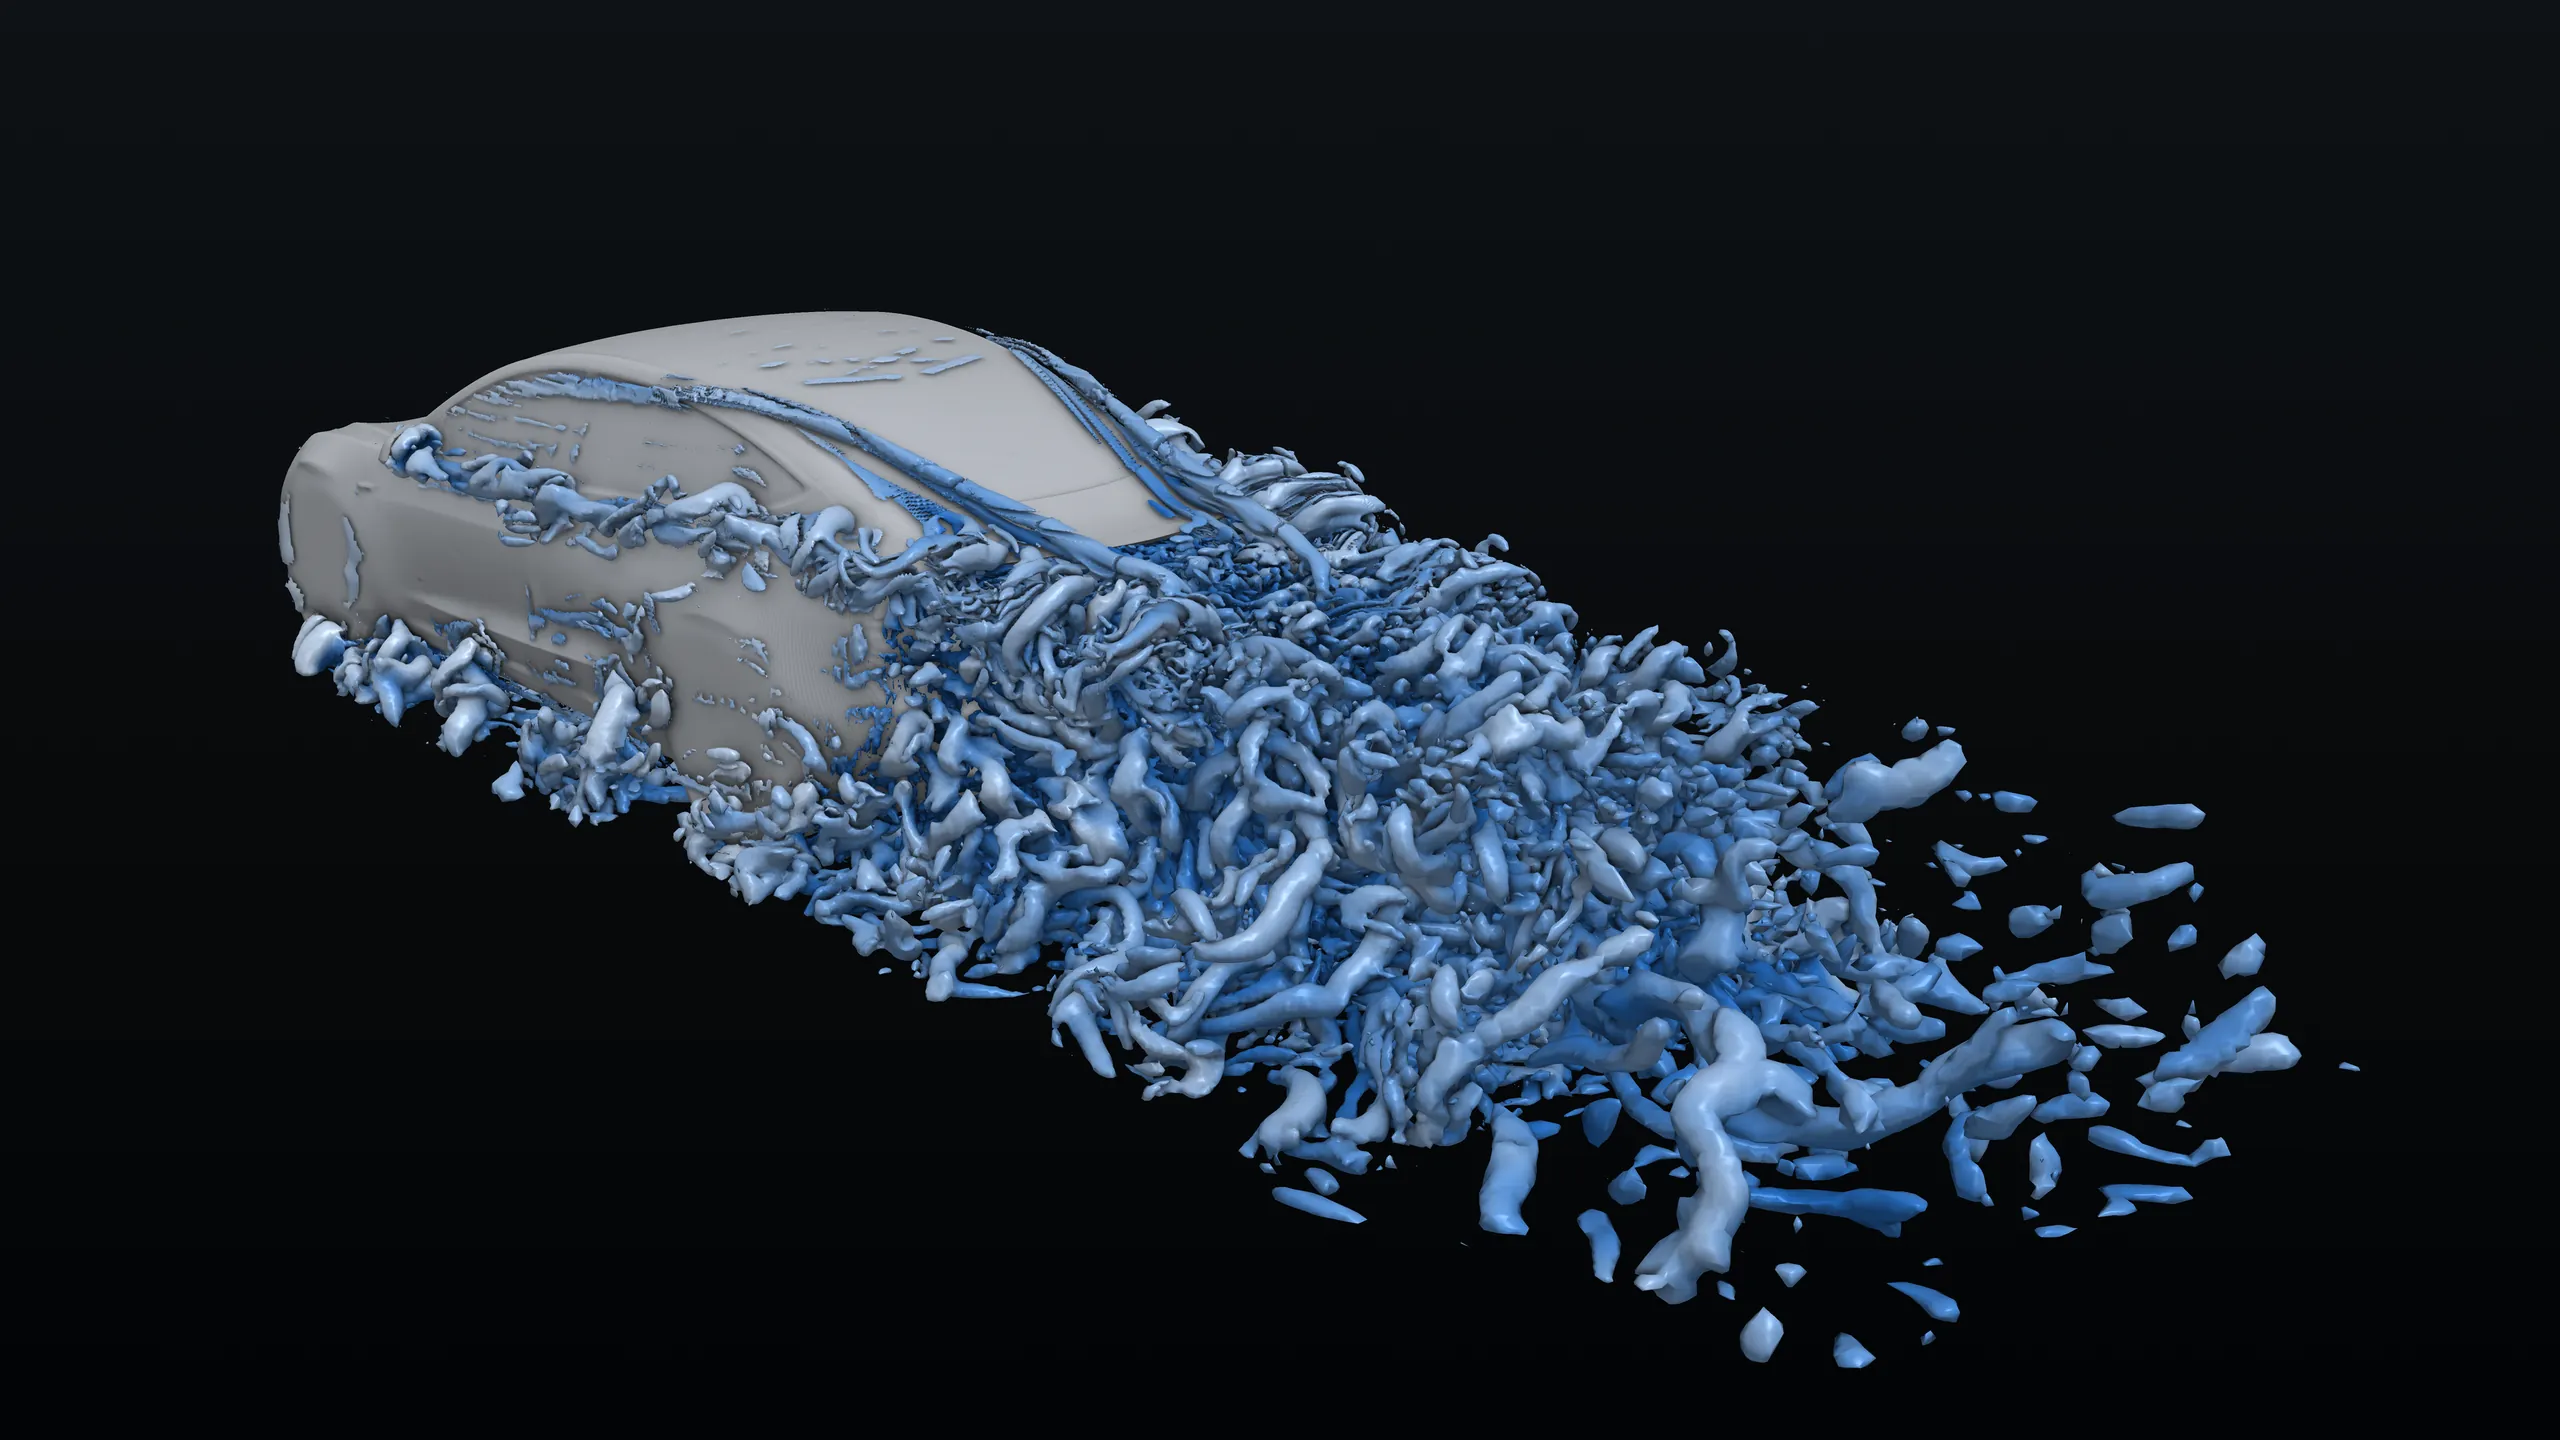
Spin it
Same car, same camera, four ways to look at it. Air arrows show which way the air moves and how fast, all the way around the car. Switch between no spoiler, V3 Beta and V3 Alpha, or hit Flip, and the angle stays put, so you compare like for like.
Each dash rides the simulated airflow at its own speed, in 30x slow motion for every car. Bright dashes mark where the spoiler changes the airflow, by more than 4 mph or in direction; dim ones barely change. Longer and yellower is faster. Averaged over about half a second of simulated driving; the car is colored by the pressure on its skin.
Where the downforce comes from
The average pressure on the back of the car. Drag the handle: with the V3 Alpha the air slows down over the trunk lid, and the red patch grows. Pressure on a surface that faces up pushes the car down.
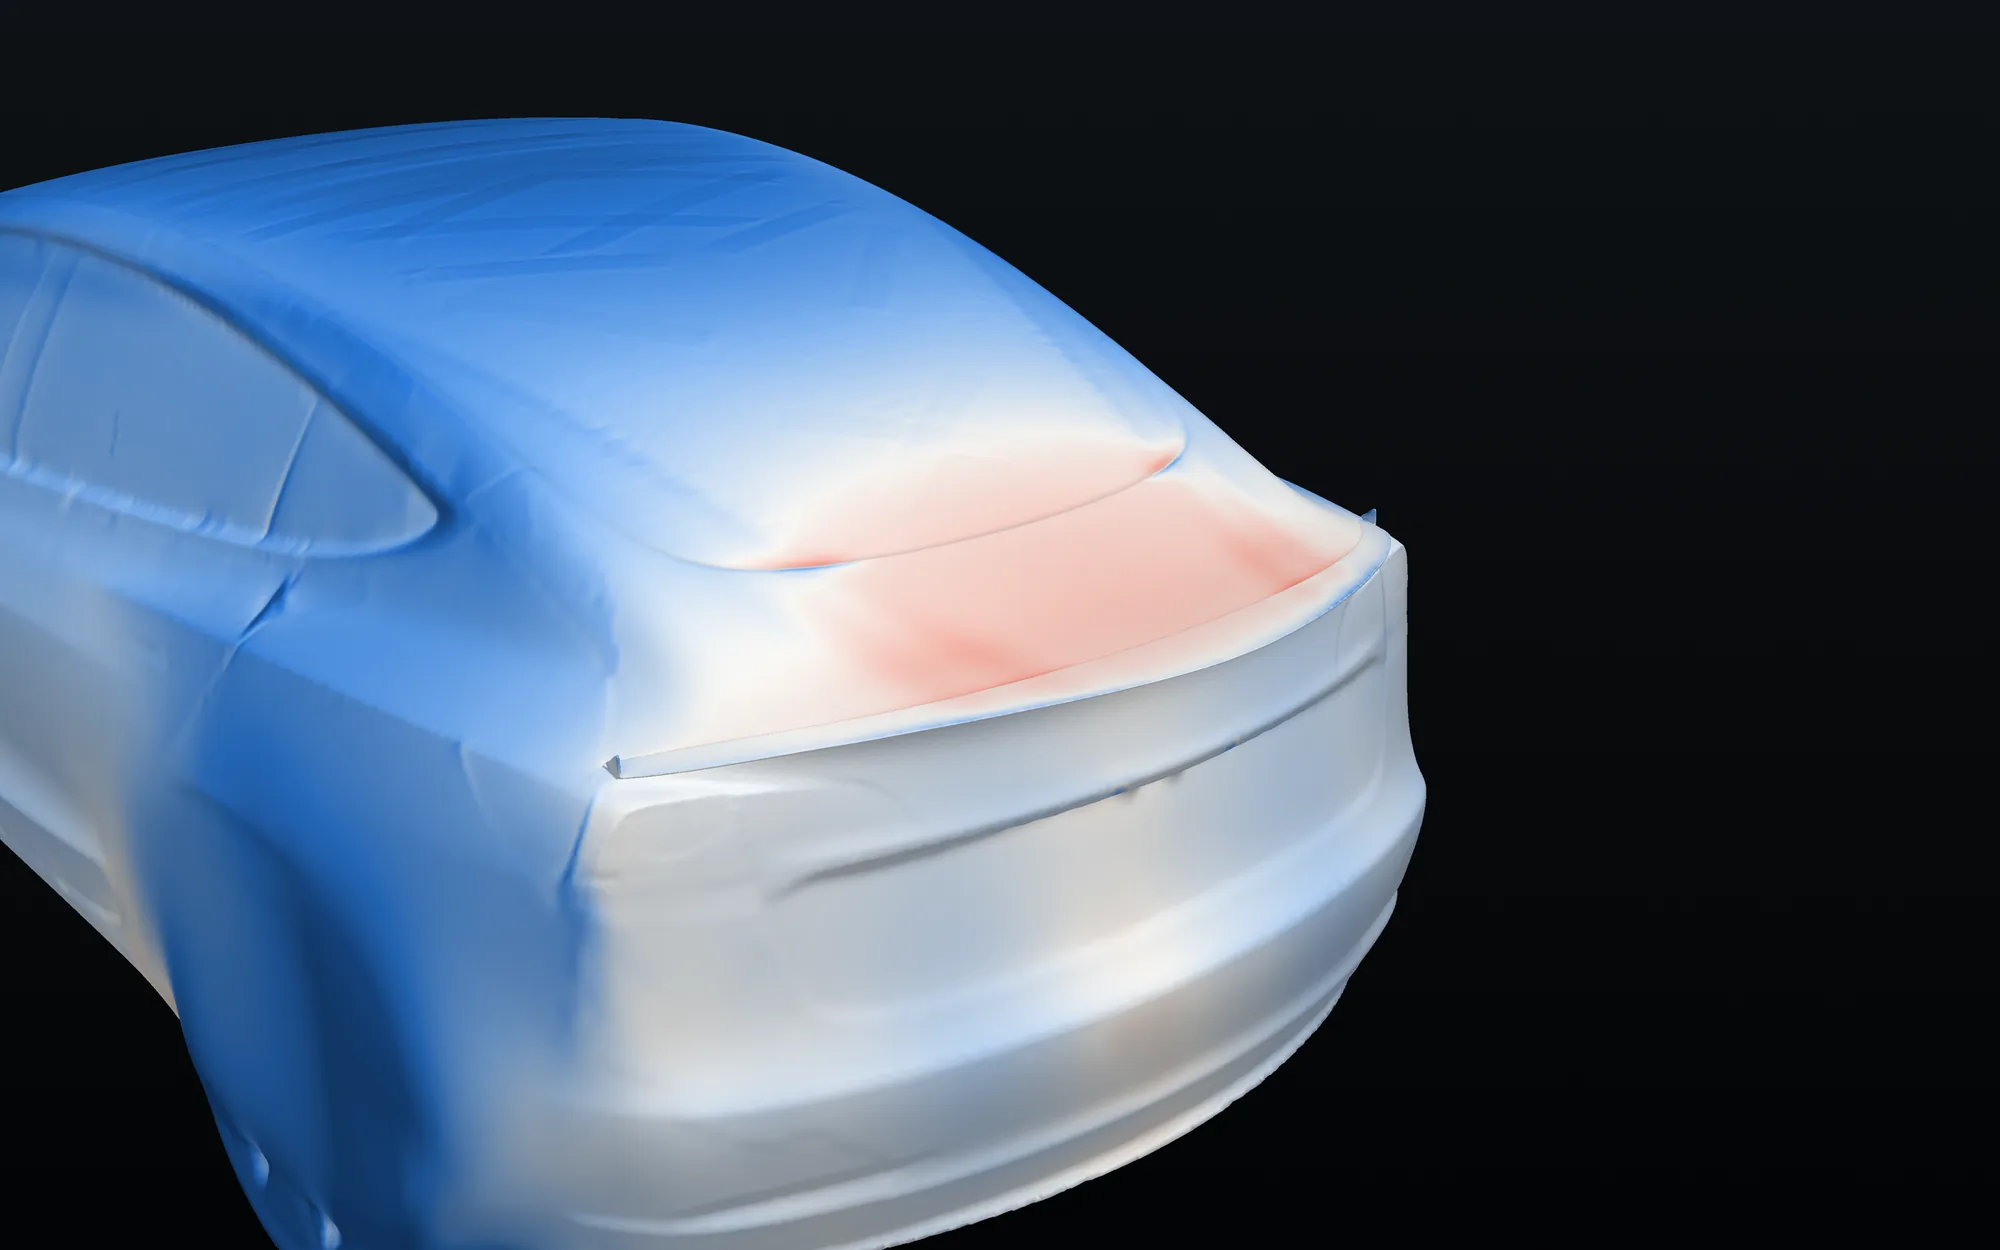
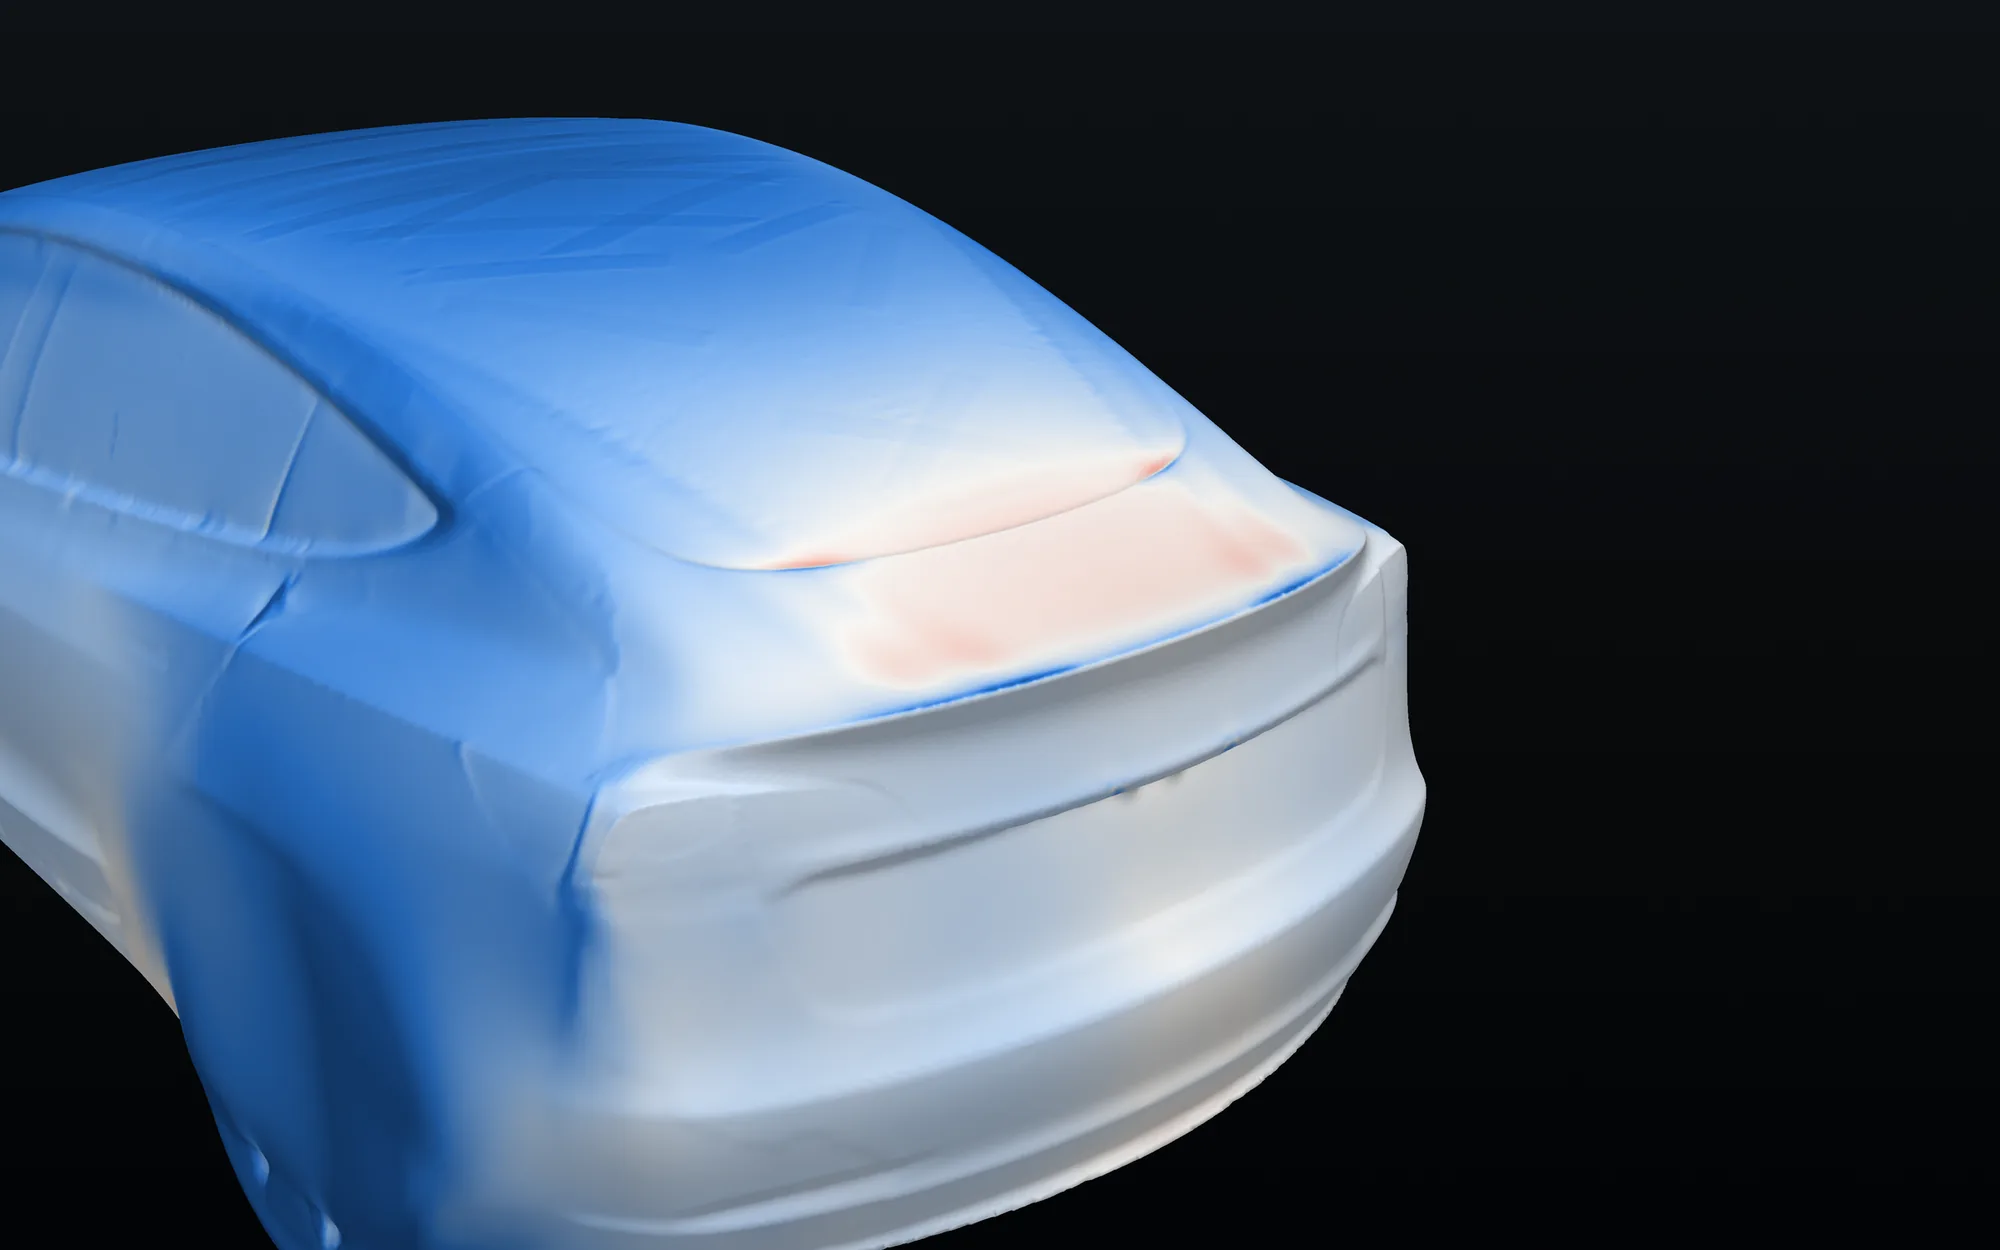
Pressure coefficient: 0 is the pressure of still air. At 80 mph the ends of this scale are about 470 Pa, roughly 10 lb on every square foot.
The wake
Behind every car trails a wake of slow, tumbling air, and the wake is where drag comes from. These slices cut through the air down the middle of the car and across it at trunk height. Grey is air passing at the car’s own speed; blue is slower, red is faster.
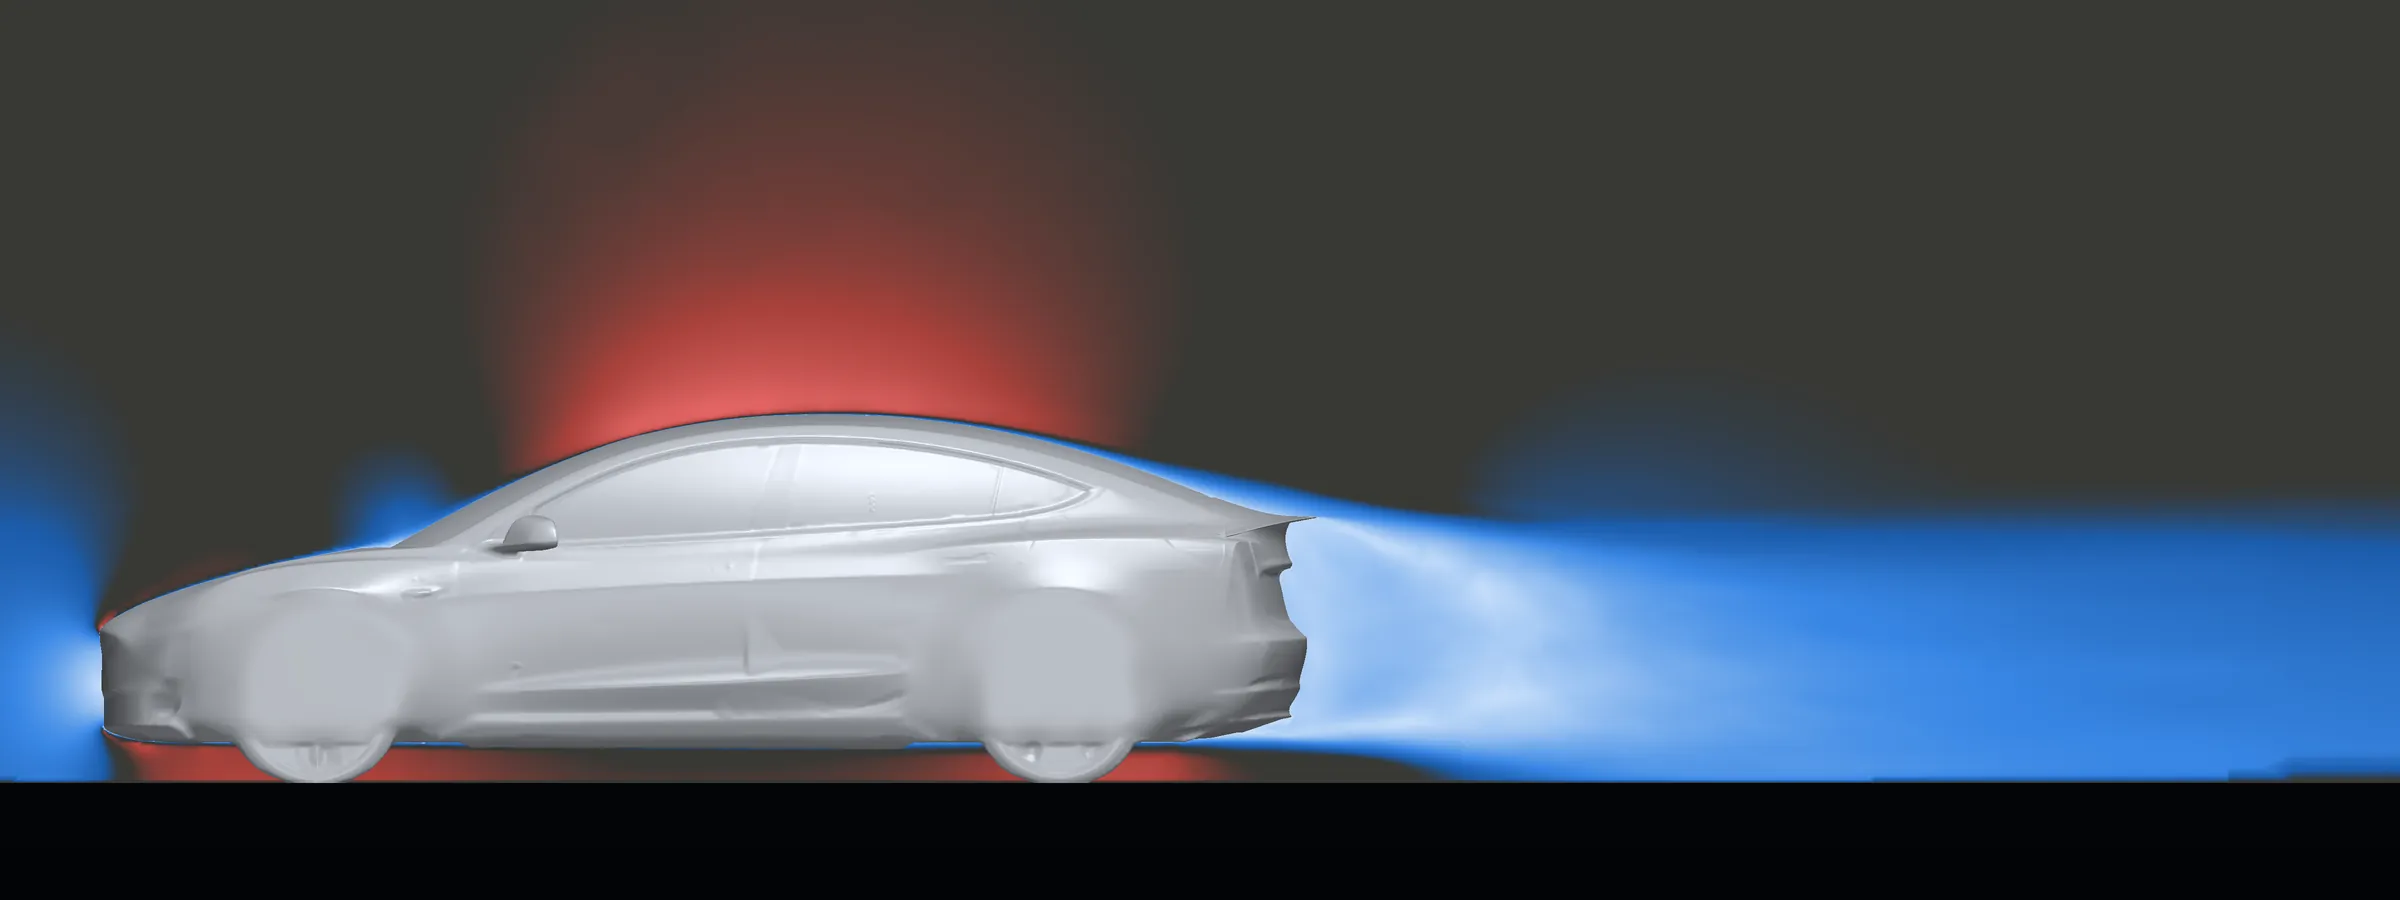
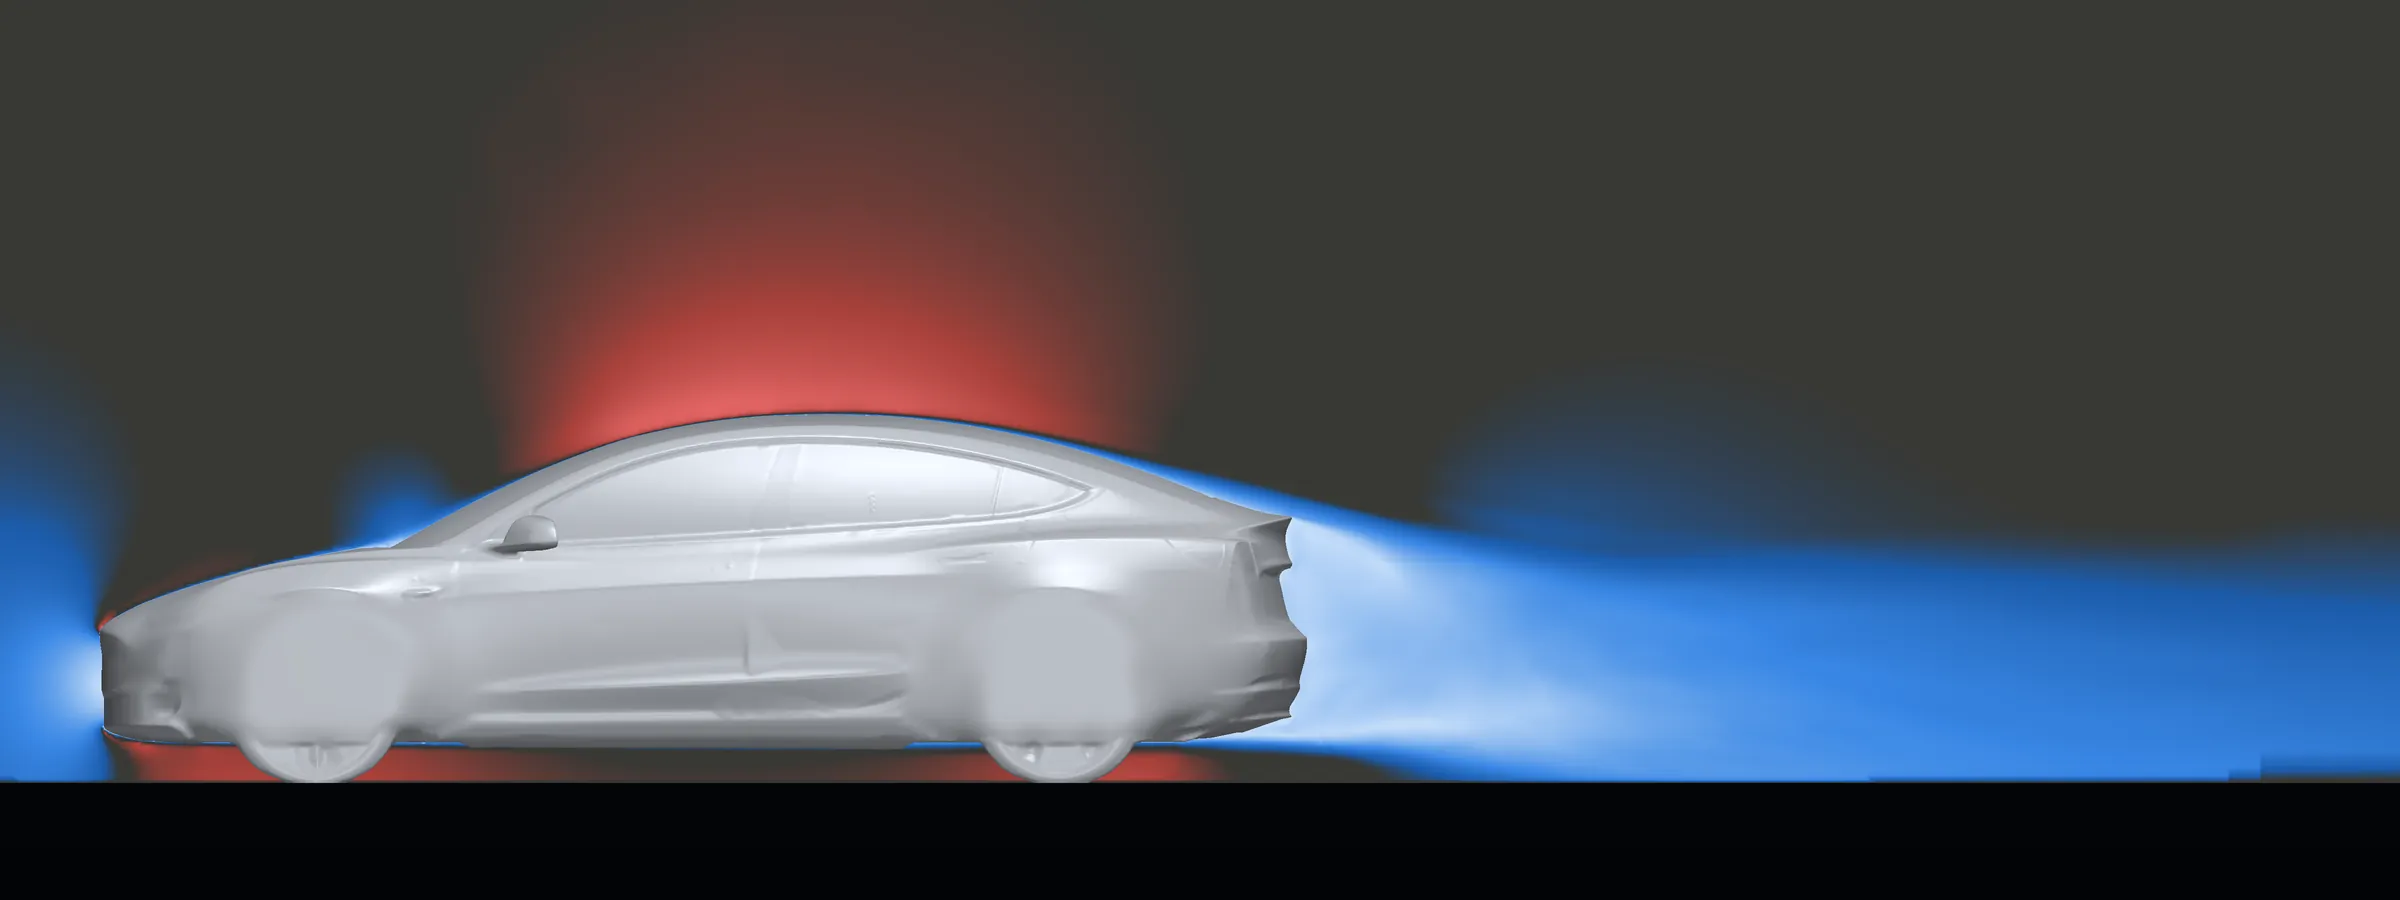
The difference is subtle, and that is the honest answer. The V3 Alpha saves about 15 N of drag on the rear glass and deck, and the body ahead of it gives about 8 N of that back: a net 7 N, or 2% of the car’s drag at 80 mph.
How the answer sharpened
We ran the same comparison on three meshes. The mesh is the grid of cells the air is solved on: a finer grid catches smaller swirls and costs far more compute. Here is what each one said about the V3 Alpha.
Drag change
Rear-axle lift change
Lift change on the rear glass and deck
- At about 2 million cells the simulation said the spoiler adds 17 N of drag. That mesh is too coarse to resolve a spoiler, so we don’t use it for spoiler numbers.
- At about 9 million cells drag fell by 15 N. At 17.2 million, our finest, it falls by 7 N, about 2%. The drag saving is small and it moved with the mesh, so it could move again on a finer one.
- The load on the rear glass and deck settled: 56 N of downforce at 9 million cells, 54 N at 17 million. Total rear downforce came out at about 110 N on the finest mesh, with a tighter error bar than any earlier run.
- Bars are ±1 standard error. We publish every level, not just the best-looking one.
The numbers, finest mesh
Transient DDES in OpenFOAM at 80 mph, zero yaw, moving ground. ± is one standard error.
| No spoiler | V3 Beta | Change | V3 Alpha | Change | |
|---|---|---|---|---|---|
| Mesh | 16.5 million cells | 17.2 million cells | 17.2 million cells | ||
| Drag | 360 N | 351 N | −10 ± 2 N (−2.7%) | 353 N | −7 ± 3 N (−2.0%) |
| Rear-axle lift | 404 N | 285 N | −119 ± 12 N | 295 N | −110 ± 11 N |
| Power to push the air aside | 12.88 kW | 12.54 kW | −0.34 kW | 12.62 kW | −0.26 kW |
Positive lift raises the rear; the change is downforce. Method and full data in the white paper.