Drag and Rear Lift of a Low-Mass Rear Spoiler With Swept Endplates on a Tesla Model 3
Abstract
A trunk-lid spoiler for the Tesla Model 3, V3 Alpha, was evaluated computationally against the same car with no spoiler. It is a full-width exoskeleton airfoil with a 0.7 mm single-wall skin and two swept endplates (25 × 30 × 3 mm) at chopped tips. Steady RANS (k-ω SST, OpenFOAM) was solved at 80 mph on two mesh levels, and transient DDES on three, up to 17.23M cells. On the finest mesh the spoiler lowered rear-axle lift by 109.5 ± 11.4 N and drag by 7.2 ± 2.6 N (2.0%). Every data set showed less rear lift. The drag change was negative in four of five data sets and moved with the mesh, from +16.6 N on the coarsest DDES mesh to −7.2 N on the finest, while the lift on the rear glass and deck agreed within 2 N between the two finer DDES meshes. An owner-reported energy change from 300 to 240 Wh/mi is far larger than the drag reduction alone predicts and has not been reproduced under controlled conditions. A second design, V3 Beta, the same airfoil with clean tips and no plates, was run on the finest mesh: −9.6 ± 2.3 N drag and −119.2 ± 12.2 N rear-axle lift, a statistical tie with V3 Alpha.
1Introduction
Rear spoilers on production sedans are usually judged by appearance. The goal of this program was different: a spoiler for the Model 3 that lowers drag and rear lift, adds as little mass as possible, and is backed by simulation data that a buyer can read. The development rule was simple. Every design runs in CFD first; only designs that hold up in simulation get made; parts are released after they prove themselves on a car.
This revision documents V3 Alpha against the same vehicle with no spoiler: the steady screen at two mesh levels, the transient runs at three, and what the numbers do and do not support. It also reports V3 Beta, the same airfoil with clean tips and a 1,380 mm span, on the finest mesh with the same protocol (Section 4.5).
2Vehicle and spoiler geometry
The vehicle is a surface model of a 2017 to 2023 (pre-Highland) Model 3 with side mirrors and a closed lower grille opening, shared unchanged by all cases. The spoiler was united with the trunk lid in its mounted position, so the two configurations differ only at the rear deck.
The airfoil wraps the rear edge of the trunk lid and runs tip to tip, with a depth of 102 mm at the centerline tapering to 59 mm outboard and a profile height of up to 26 mm. The structure is an exoskeleton: a single 0.7 mm wall of carbon fiber reinforced plastic is both the aerodynamic surface and the structure (Figure 2). Each tip is chopped slightly and carries a swept plate whose outboard face is flush with the tip.
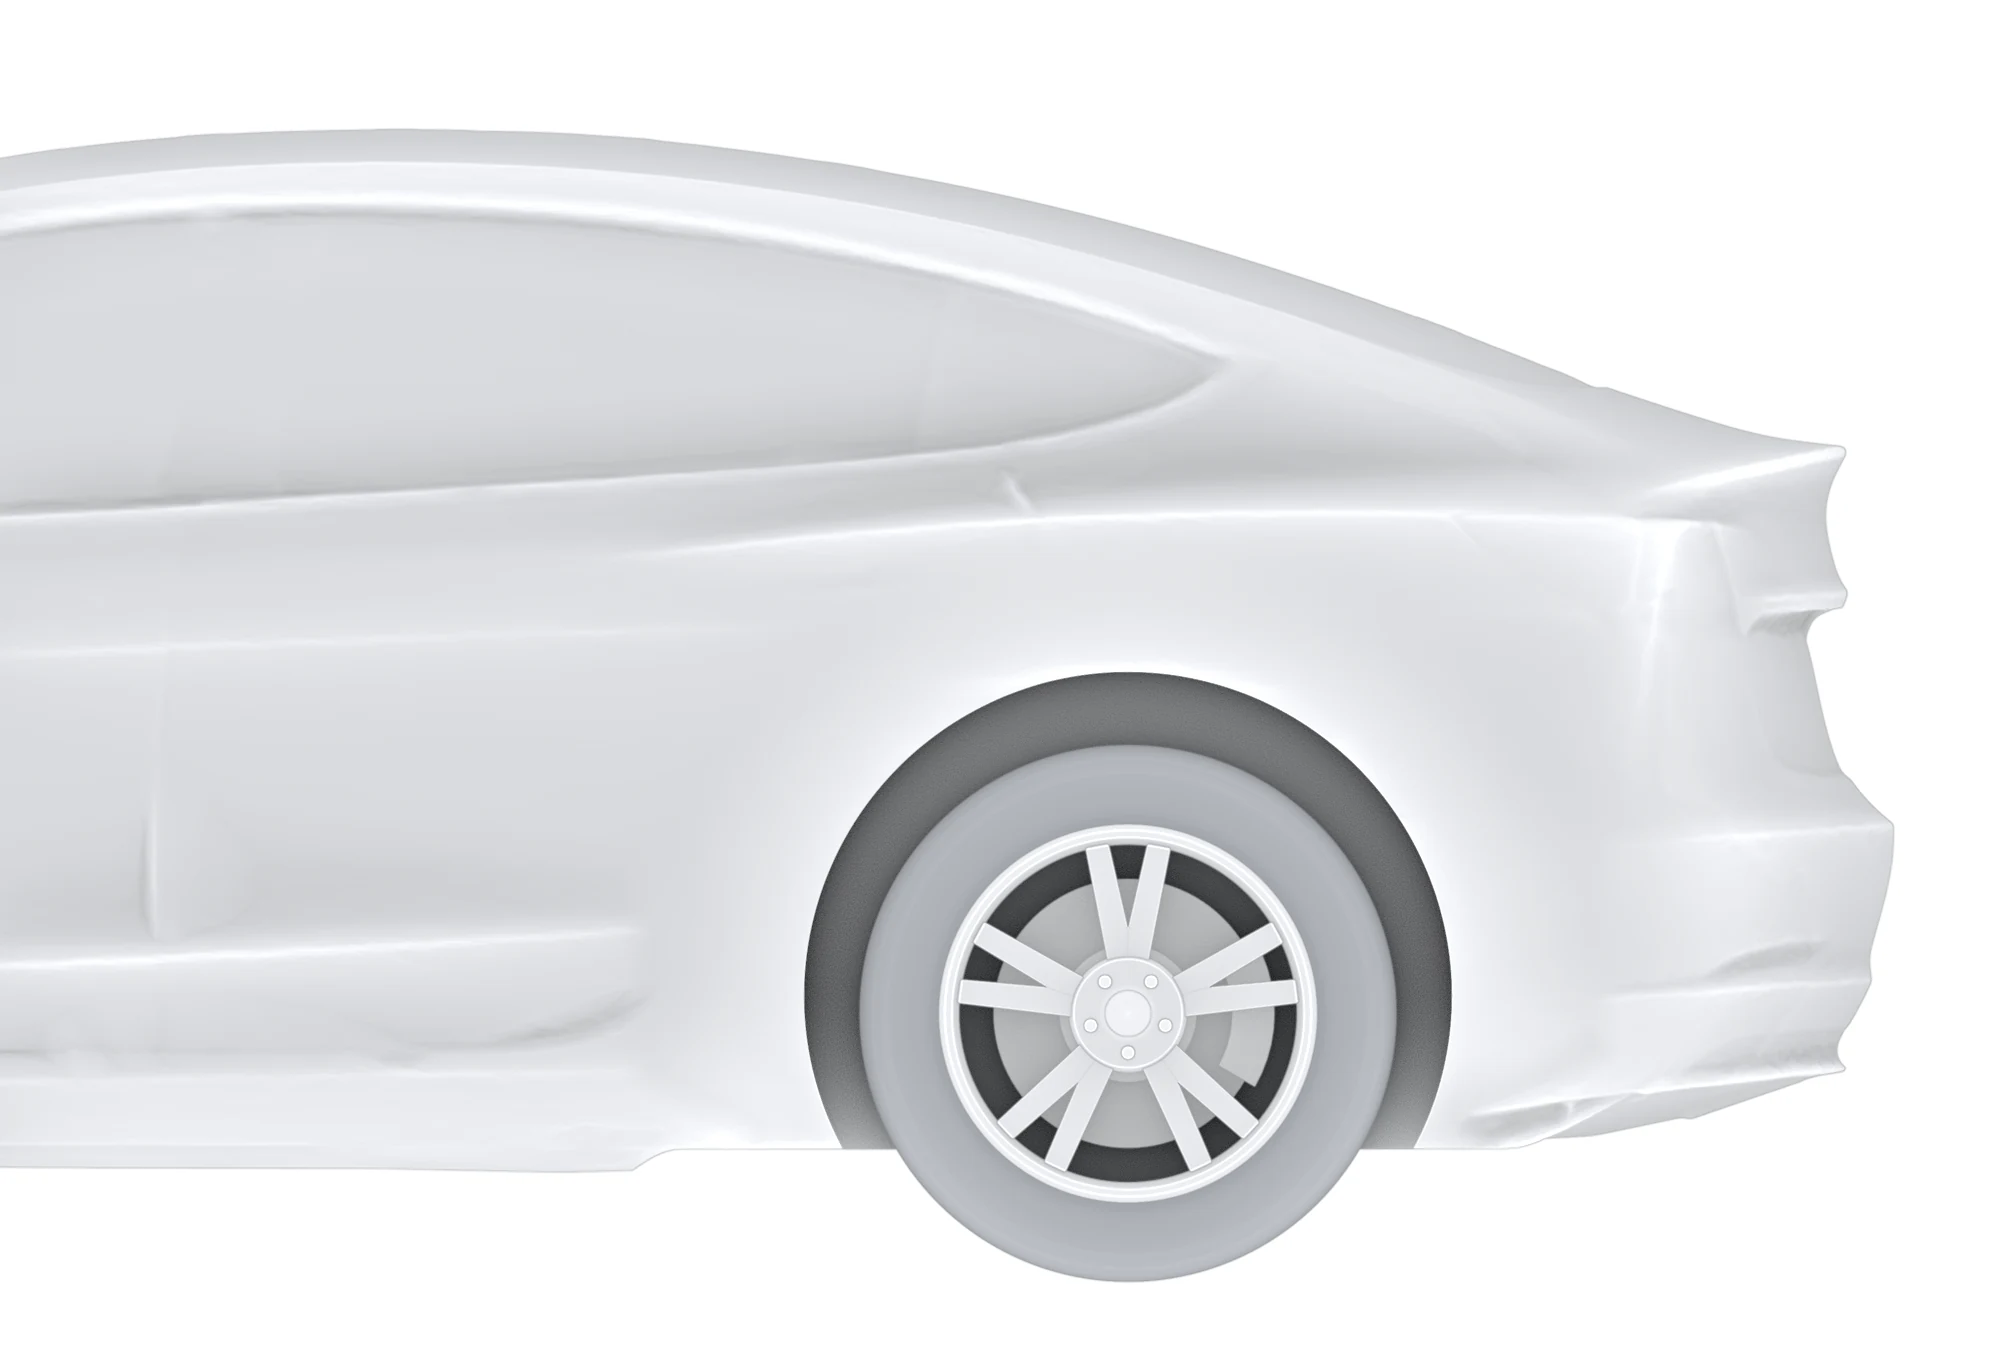 No spoiler, side
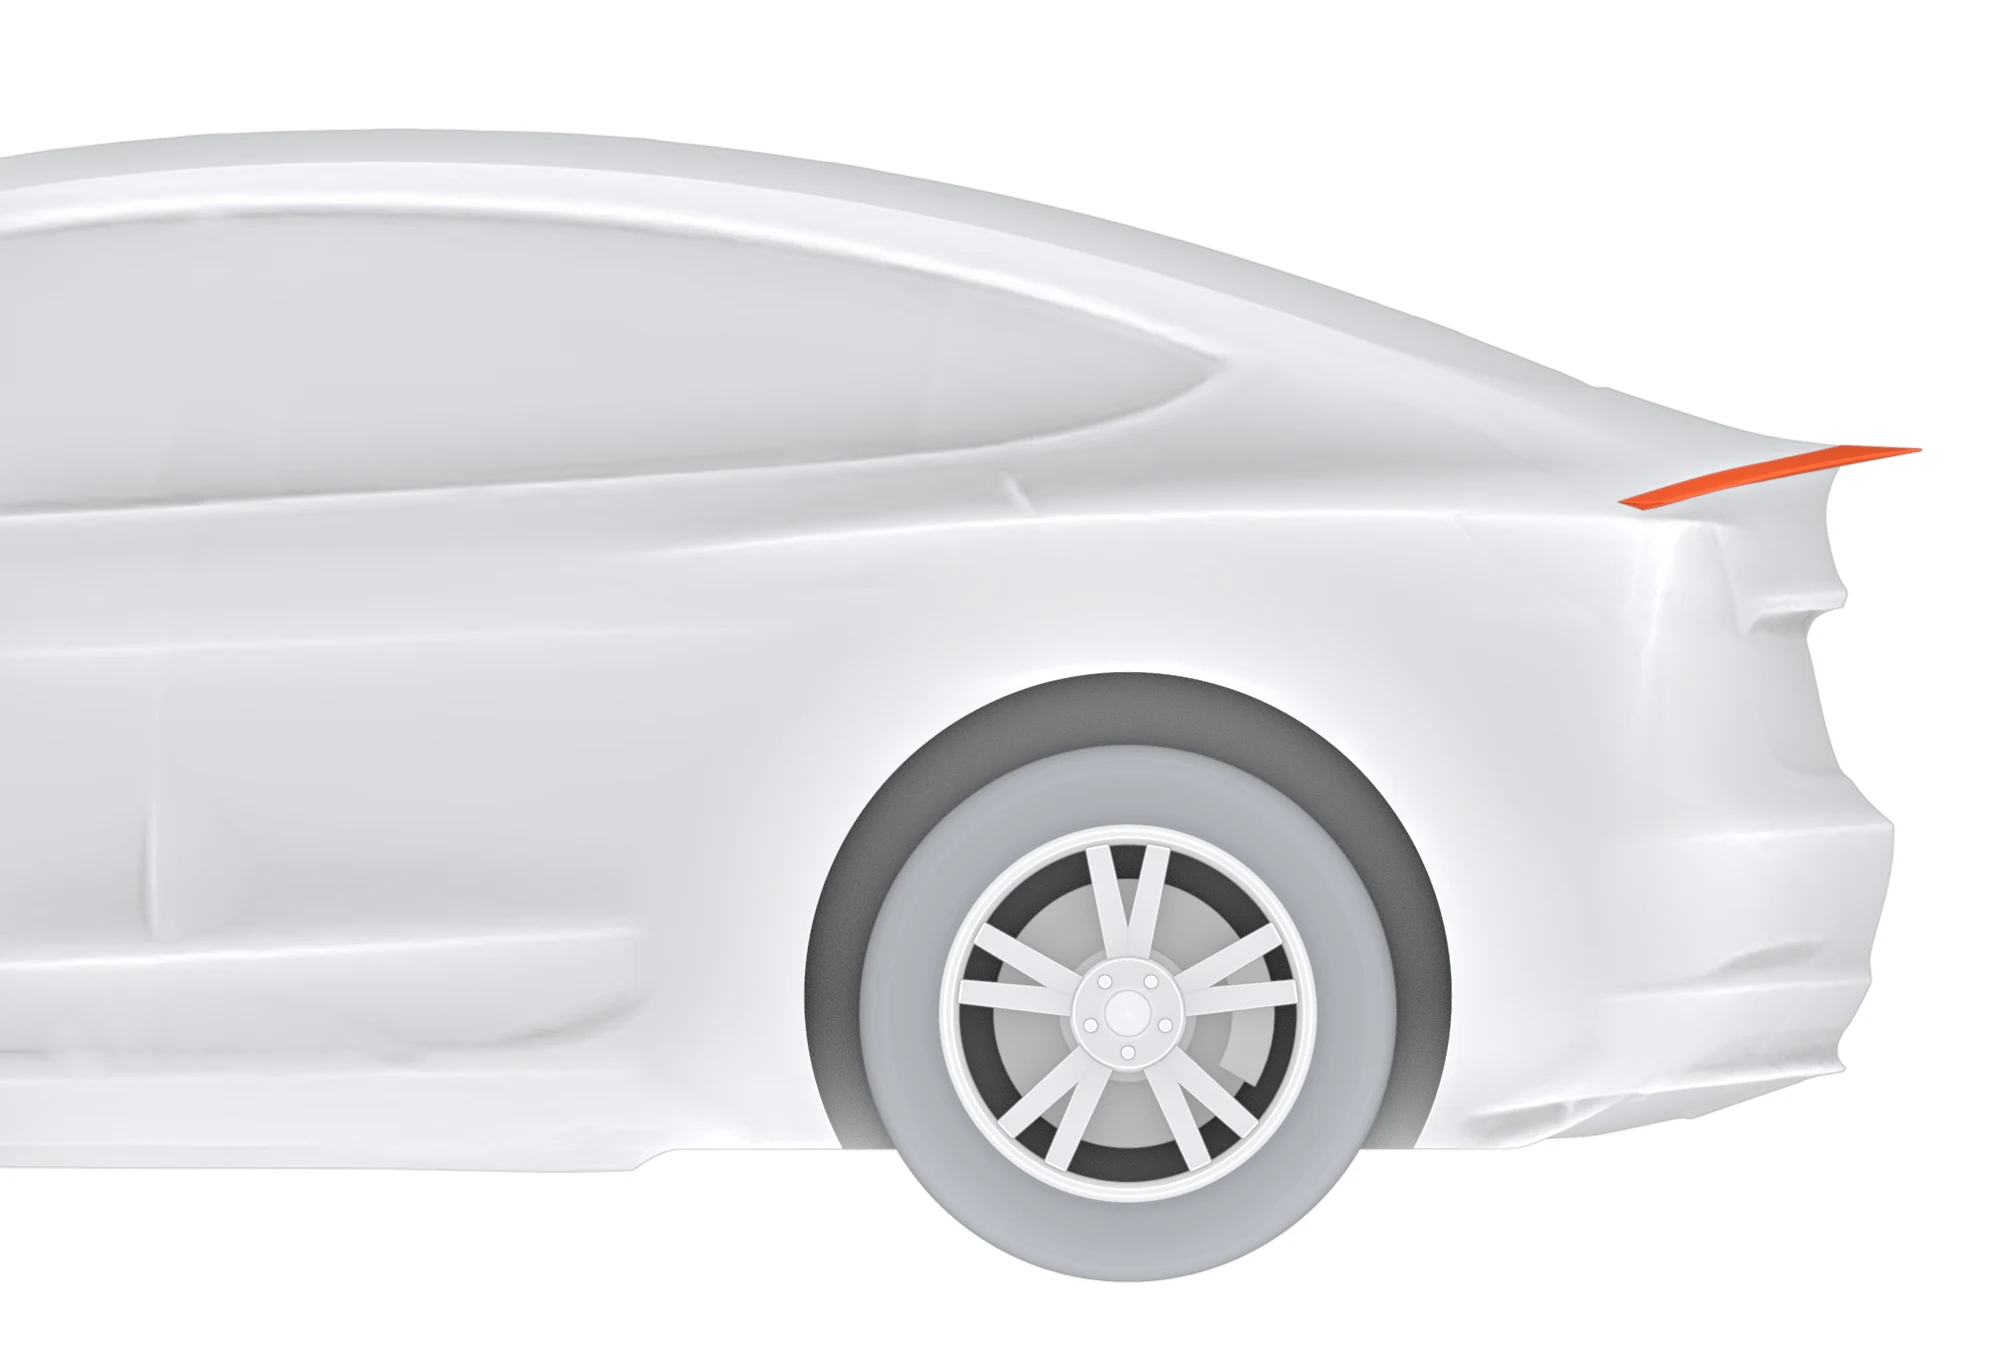 V3 Beta, side
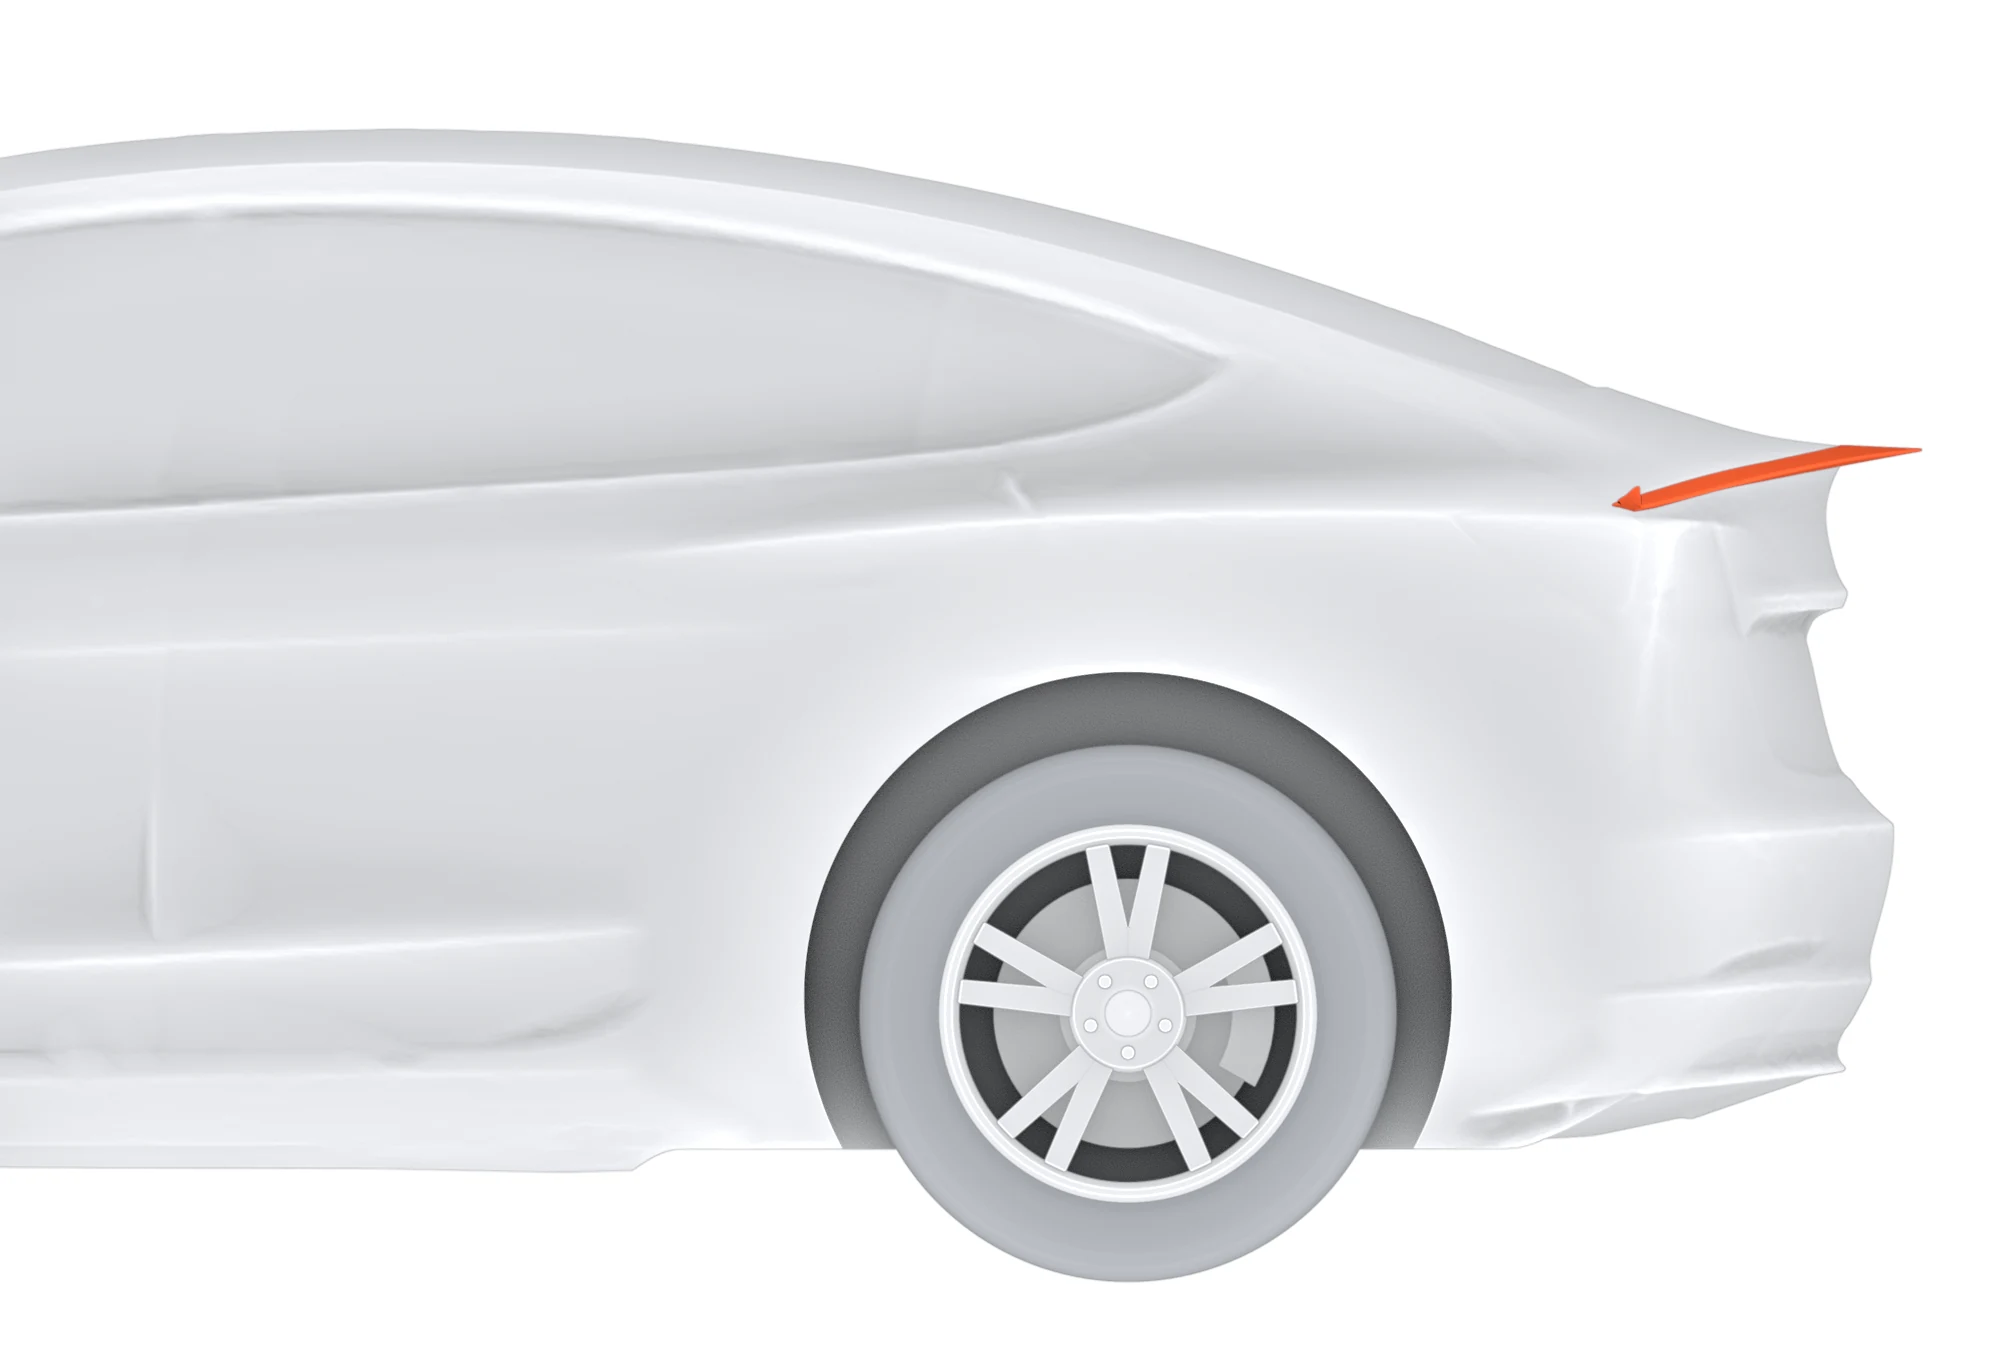 V3 Alpha, side
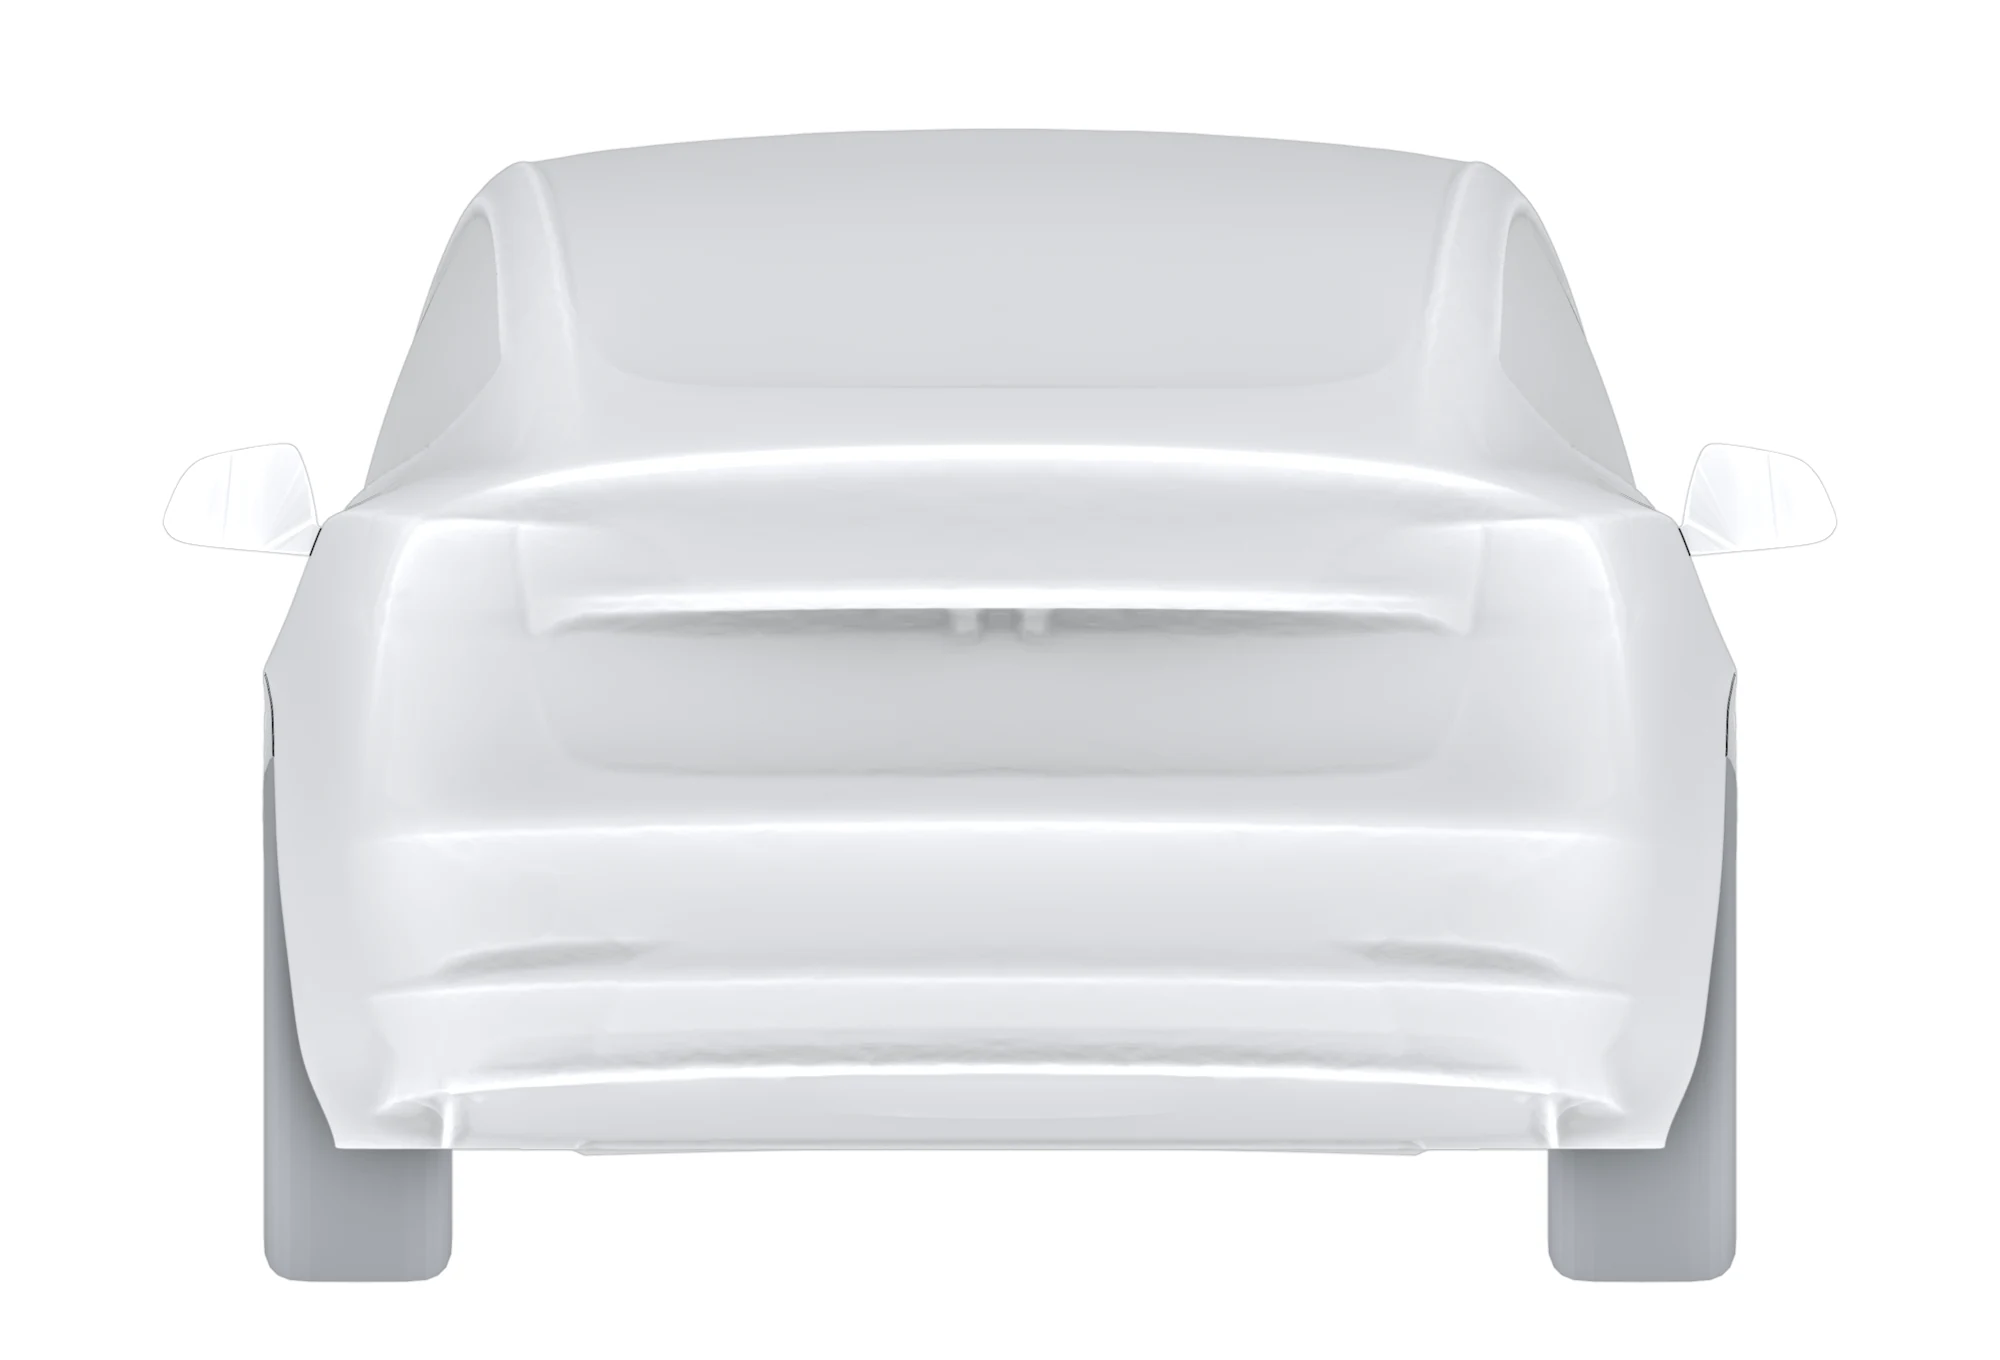 No spoiler, rear
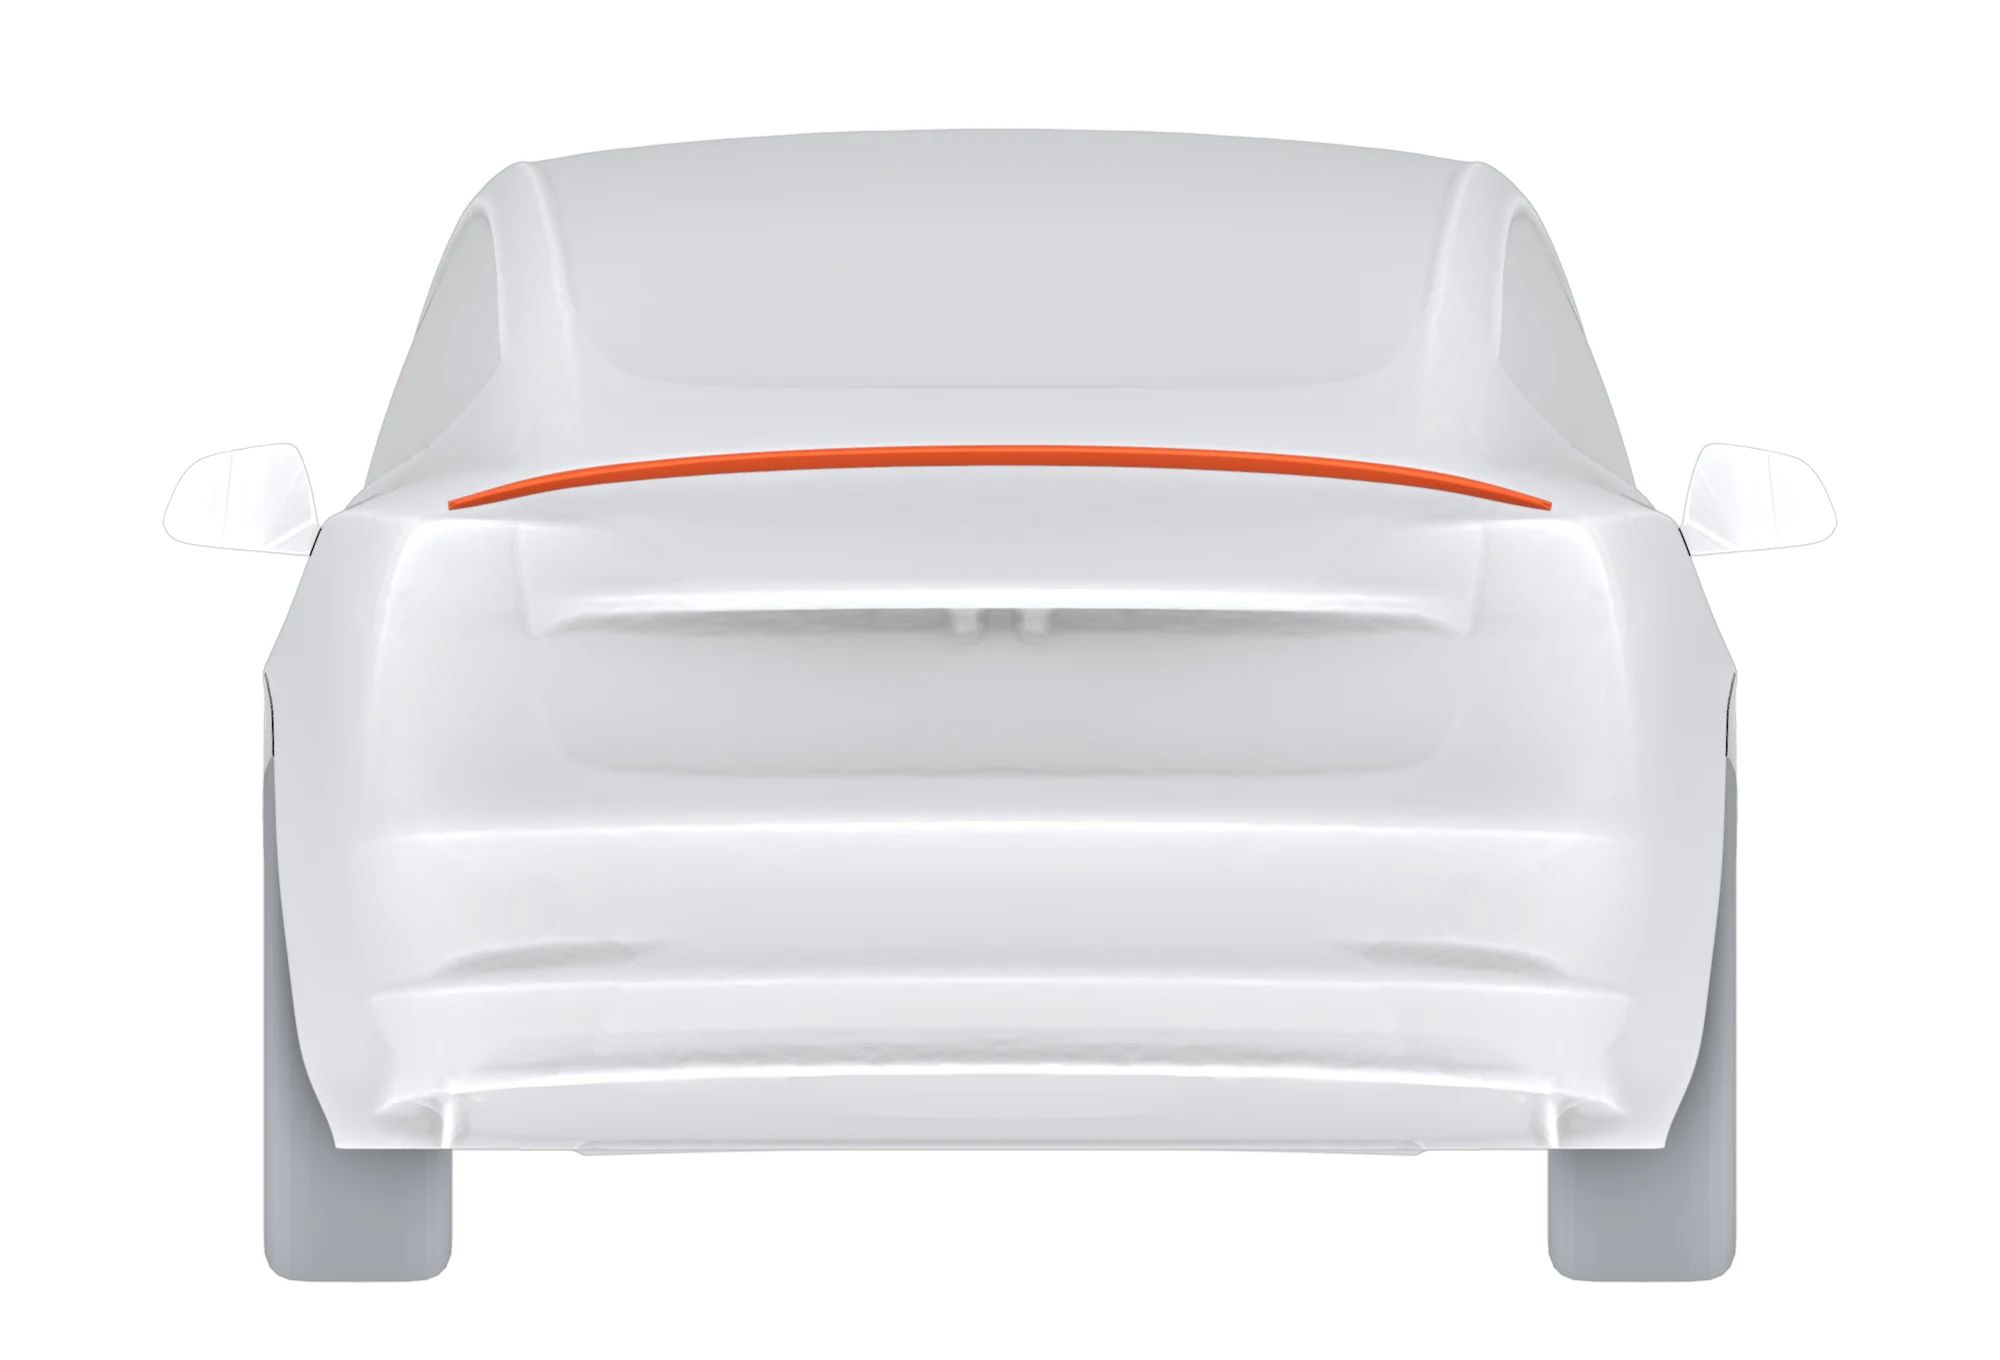 V3 Beta, rear
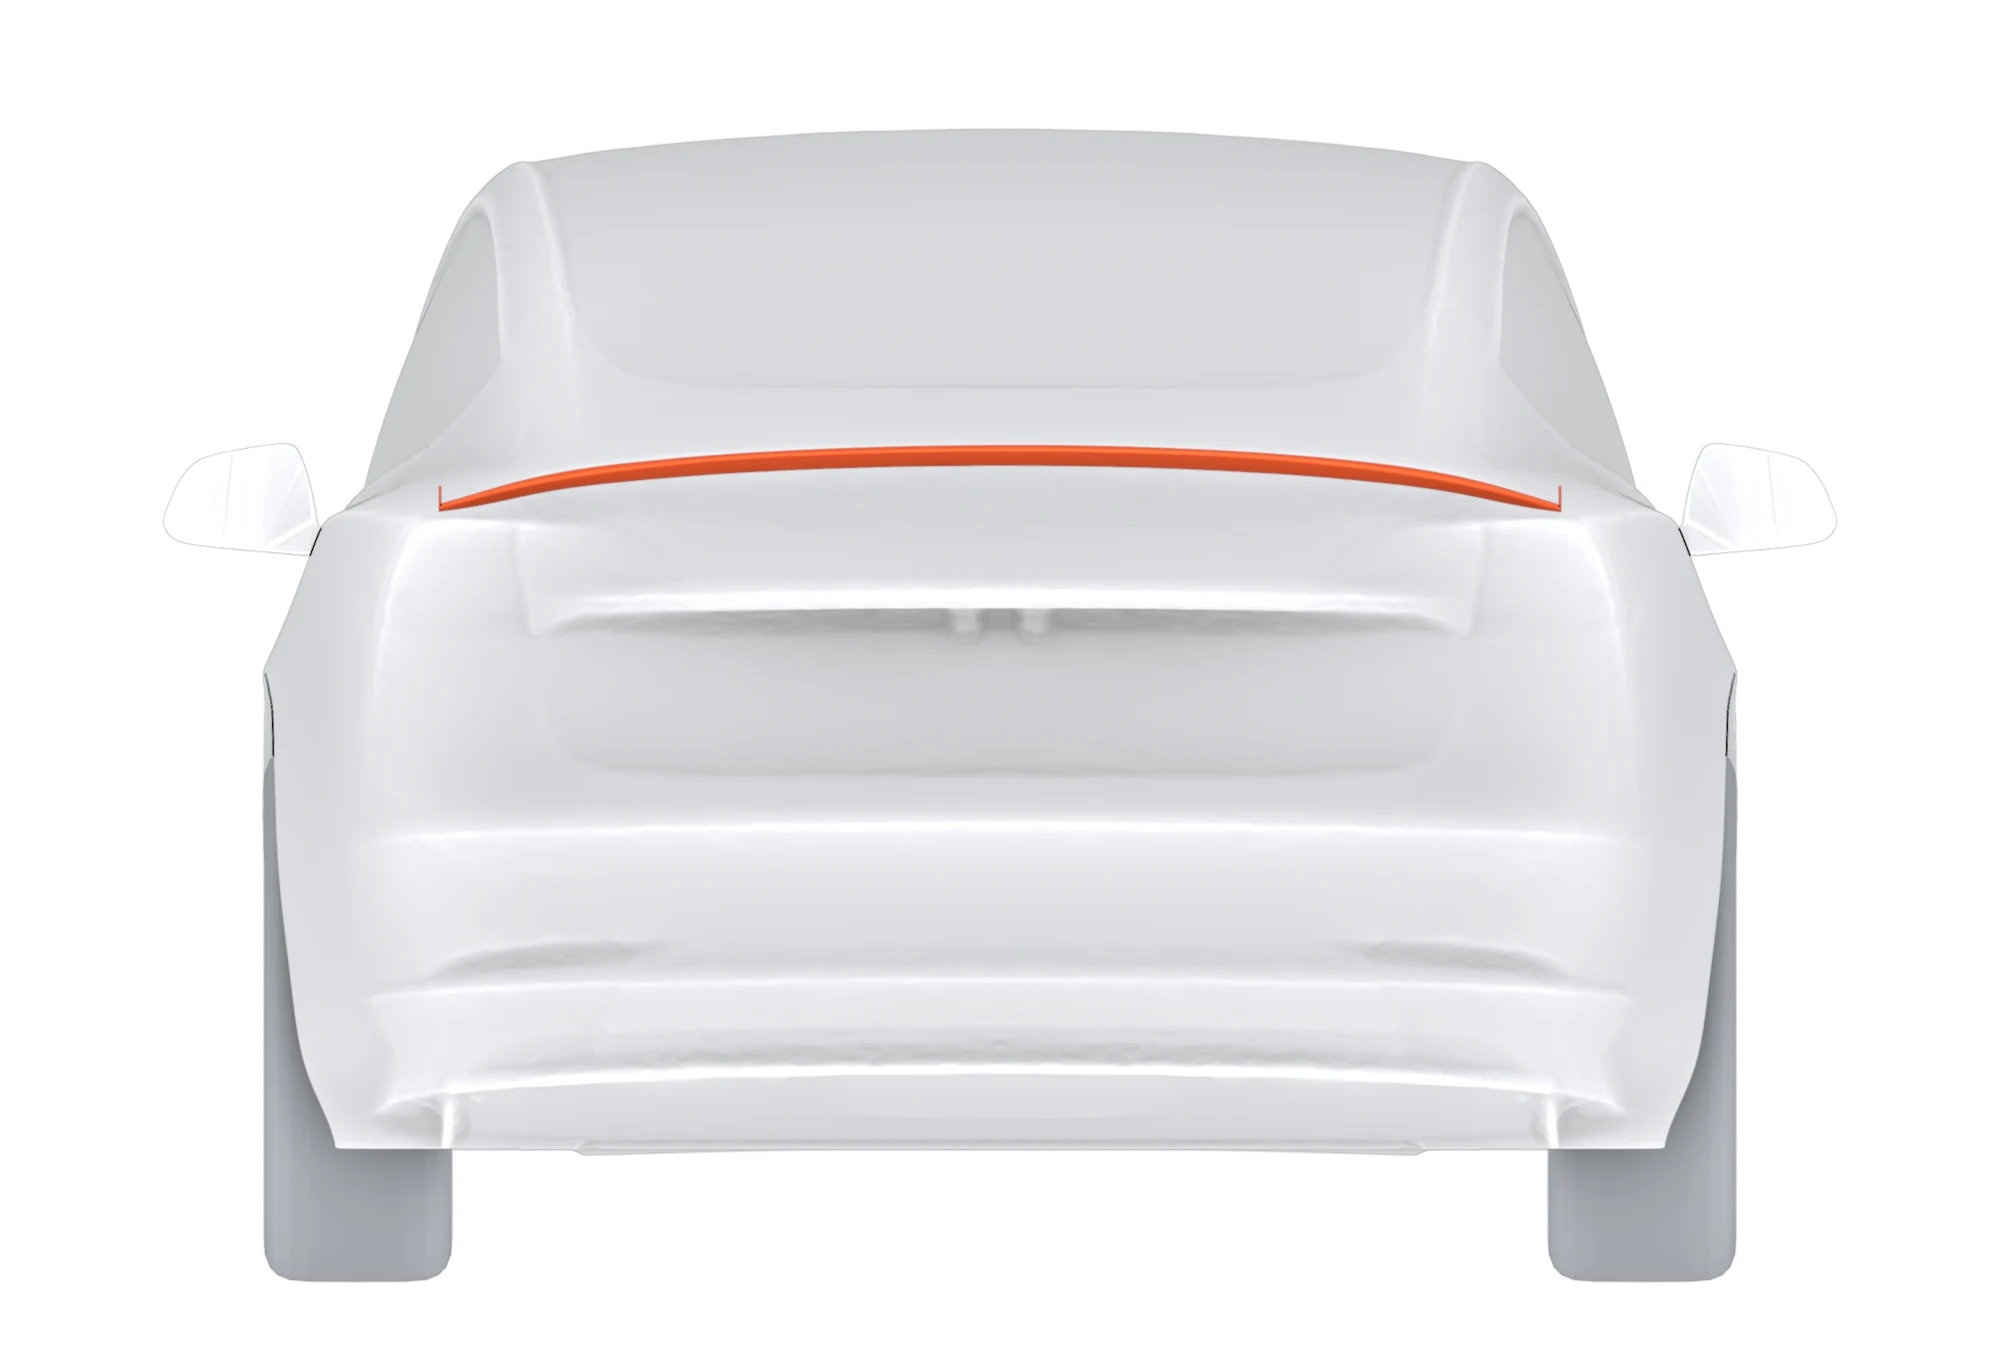 V3 Alpha, rear
Table 1. V3 Alpha geometry and calculated mass.
| Span, tip to tip | 1,423 mm |
| Depth, centerline / outboard | 102 mm / 59 mm |
| Profile height, max | 26 mm |
| Skin | 0.7 mm single wall |
| Endplates (h × l × t) | 2 × (25 × 30 × 3 mm) |
| Mass, calculated from CAD | ≈225 g |
Mass is calculated from the CAD skin at the 0.7 mm wall and excludes section joints and tape. It is not a measured weight; the measured finished weight will be published separately.
3Computational method
3.1 Solver and models
All cases were solved with OpenFOAM v2506 [1]. The steady cases use the incompressible SIMPLE-consistent algorithm with the k-ω SST turbulence model [2], second-order linear-upwind convection for momentum and first-order upwind for the turbulence equations, and Spalding wall functions. Each was initialized from a potential-flow solution and run for 2,000 iterations. The transient runs use the k-ω SST DDES formulation [3, 4] with second-order backward time integration, LUST convection and a time step of 5 × 10⁻⁵ s.
On the middle mesh level both cases were restarted from their steady solutions and averaged over 0.5 to 0.94 s. On the coarsest and finest levels the no-spoiler case ran from 0 to 0.94 s and was averaged over 0.5 to 0.94 s; the spoiler case started from the no-spoiler flow at 0.94 s, mapped onto its own mesh, was given 0.25 s to adjust, and was averaged over the following 0.44 s, the same length of window.
3.2 Domain and boundary conditions
The domain is a 76 × 24 × 12 m box with the inlet about five car lengths ahead and the outlet about ten behind; blockage is under 1 %. Inflow is uniform at 35.76 m/s (80 mph) with air density 1.225 kg/m³. The ground moves at the freestream speed; the sides and top are slip walls; the outlet holds zero gauge pressure. Wheels are stationary no-slip surfaces in every case, so wheel-rotation effects cancel in the comparisons.
3.3 Meshes
Hex-dominant meshes were built from a 1 m background. On the coarsest level the spoiler surface is resolved at about 2 mm with its edges at 1 mm; the middle level refines every surface and wake region by one level, capping the spoiler at about 1 mm; the finest level refines further, to 16.55M and 17.23M cells. On the two steady levels the body carries four prism layers (0.5 mm first layer, growth 1.15). Cell counts are listed in Tables 2 and 4.
3.4 Averaging, uncertainty and force accounting
Steady coefficients are means over iterations 1501 to 2000; the quoted uncertainty is the standard error corrected for autocorrelation (σ/√Neff). DDES coefficients are means over 0.44 s of flow time (about 3.4 vehicle lengths of flow), with standard errors from ten batch means. Coefficients use Aref = 2.202 m², so one coefficient unit equals 1,725 N at 80 mph. Front and rear lift are split about the axles. On the finest mesh, forces were also integrated separately over the front body, the mid body and underbody, and the rear glass and deck including the trunk lip and spoiler.
4Results
4.1 Convergence
Figure 3 shows the drag and rear-lift histories on the finer steady mesh. As is typical for a bluff wake in steady RANS, the solutions do not reach a fixed point: the coefficients keep oscillating, and the no-spoiler case still drifts by about 0.005 in CD between the last two 500-iteration blocks. That is a large fraction of the spoiler effect, which is why the steady results are treated as a screen and checked with DDES (Section 4.4).
- No spoiler
- V3 Alpha
Drag coefficient, CD
Rear lift coefficient, CL,rear
4.2 Steady coefficients
Table 2. Steady RANS coefficients, means over iterations 1501 to 2000.
| Case | Mesh | Cells | CD | CL | CL,front | CL,rear |
|---|---|---|---|---|---|---|
| No spoiler | Coarser | 1.80M | 0.2737 ± 0.0044 | 0.1340 | -0.0089 | 0.1429 ± 0.0047 |
| V3 Alpha | Coarser | 2.05M | 0.2591 ± 0.0015 | 0.0297 | -0.0229 | 0.0526 ± 0.0035 |
| No spoiler | Finer | 8.55M | 0.2582 ± 0.0046 | 0.1474 | -0.0329 | 0.1802 ± 0.0025 |
| V3 Alpha | Finer | 9.24M | 0.2420 ± 0.0013 | 0.0884 | -0.0325 | 0.1209 ± 0.0018 |
4.3 Changes against the car with no spoiler
Table 3 gives the steady effect of the spoiler as the difference from the no-spoiler case on the same mesh, and Figure 4 sets it beside the three DDES results. Forces are at 80 mph; negative lift means more downforce.
Table 3. Steady RANS changes with V3 Alpha against the no-spoiler car.
| Mesh | ΔCD | Drag, N | Drag, % | ΔCL,rear | Rear lift, N | Total lift, N |
|---|---|---|---|---|---|---|
| Coarser | −0.0146 | −25.2 | −5.3 | −0.0903 | −155.8 | −179.9 |
| Finer | −0.0162 | −28.0 | −6.3 | −0.0593 | −102.3 | −101.7 |
- V3 Alpha
Drag change at 80 mph
Rear lift change at 80 mph
4.4 Transient results (DDES)
Table 4 gives the DDES change on each mesh. Absolute drag is lower in DDES than in the steady runs, so comparisons are made within one method only. Table 5 gives the finest mesh in full.
Table 4. DDES changes with V3 Alpha against the no-spoiler car, ±1 standard error, newtons at 80 mph.
| Mesh | Cells, no spoiler / V3 Alpha | Δ drag | Δ rear lift | Δ lift, rear glass and deck |
|---|---|---|---|---|
| Coarsest | 1.80M / 2.05M | +16.6 ± 2.9 | −83.5 ± 12.4 | −32.9 ± 2.1 |
| Middle | 8.55M / 9.24M | −15.2 ± 4.8 | −61.6 ± 29.7 | −55.6 ± 2.1 |
| Finest | 16.55M / 17.23M | −7.2 ± 2.6 | −109.5 ± 11.4 | −53.6 ± 1.6 |
Table 5. Finest mesh, DDES means over 0.5 to 0.94 s (no spoiler) and 0.25 to 0.69 s (V3 Alpha), ±1 standard error.
| No spoiler | V3 Alpha | Change, N | |
|---|---|---|---|
| CD | 0.2088 ± 0.0010 | 0.2046 ± 0.0012 | −7.2 ± 2.6 |
| CL,rear | 0.2344 ± 0.0053 | 0.1709 ± 0.0039 | −109.5 ± 11.4 |
| CL, rear glass and deck | 0.2665 ± 0.0008 | 0.2354 ± 0.0005 | −53.6 ± 1.6 |
| Drag power | 12.88 kW | 12.62 kW | −0.26 kW |
Table 6. Where the change happens with V3 Alpha, finest mesh: change by body zone, newtons at 80 mph.
| Zone | Δ drag | Δ rear lift |
|---|---|---|
| Front body | 0.0 ± 1.2 | −0.2 ± 1.0 |
| Mid body and underbody | +7.6 ± 2.4 | −51.1 ± 10.4 |
| Rear glass and deck, with trunk lip and spoiler | −14.7 ± 0.9 | −58.1 ± 1.6 |
| of which trunk lip and spoiler | −5.3 ± 0.5 | −28.1 ± 0.5 |
Moving the start of the averaging window from 0.25 to 0.45 s changes the drag result between −7.2 and −9.3 N and the rear-lift result between −101.8 and −109.9 N.
4.5 V3 Beta on the finest mesh
V3 Beta was meshed with the finest recipe (17.22M cells) and run with the same warm start and window as V3 Alpha (Table 7). Its skin area equals V3 Alpha’s within 0.1%, so the plates are the main geometric difference between the two.
Table 7. V3 Beta and V3 Alpha against the no-spoiler car, finest mesh, newtons at 80 mph, ±1 standard error.
| V3 Beta | V3 Alpha | Beta minus Alpha | |
|---|---|---|---|
| Drag | −9.6 ± 2.3 | −7.2 ± 2.6 | −2.4 ± 3.5 |
| Rear-axle lift | −119.2 ± 12.2 | −109.5 ± 11.4 | −9.7 ± 16.7 |
| Lift, rear glass and deck | −55.3 ± 1.6 | −53.6 ± 1.6 | −1.7 ± 2.3 |
| Lift, trunk lip and spoiler | −23.6 ± 0.5 | −23.1 ± 0.5 | −0.5 ± 0.7 |
| Drag, rear glass and deck | −16.4 ± 0.9 | −14.7 ± 0.9 | −1.7 ± 1.3 |
Every difference between the two designs is within two standard errors, so on this evidence the plates neither add nor cost measurable downforce or drag at zero yaw. The Beta-minus-Alpha errors here assume the two runs are independent; they share the no-spoiler baseline, so the true uncertainty of the difference is somewhat smaller.
5Discussion
5.1 Rear lift
The spoiler reduces rear lift in every data set, by 62 to 156 N, which is the most robust finding of the study. On the finest mesh about 58 N of the 110 N comes from the rear glass and deck, where the spoiler slows the air and raises the pressure on surfaces that face up. Most of the rest, 51 N, appears on the mid body and underbody: the spoiler changes the flow leaving the whole rear of the car, not only the surface it sits on. The lift on the rear glass and deck agreed within 2 N between the two finer DDES meshes. Whole-car lift drifts with a slow mode at the front of the car, so this paper reports rear and deck lift rather than total lift.
5.2 Drag
The drag change is small and depends on the mesh. The steady runs give −25.2 and −28.0 N. In DDES the coarsest mesh gives +16.6 N; it is too coarse to resolve a spoiler, and it is not used for spoiler numbers. The middle and finest meshes give −15.2 and −7.2 N. On the finest mesh the rear glass and deck save 14.7 N and the mid body gives 7.6 N back. The defensible statement is a drag reduction of about 2% at 80 mph, with the caveat that the value moved between the two finer meshes and could move again on a finer one.
5.3 Endplates
The plates are small (25 × 30 × 3 mm), so their mass cost is a few grams. Their separate effect is not isolated in this revision; that needs the same airfoil without plates on the same meshes.
5.4 Energy implications
A drag change ΔF at a steady speed costs or saves ΔF × distance in energy at the wheels. For V3 Endplate at 80 mph that is 3.2 Wh/mi on the finest DDES mesh and 12.5 Wh/mi on the finer steady mesh, before drivetrain losses. Aerodynamic drag falls with the square of speed, so the saving at 65 mph is about two thirds of that.
5.5 Owner-reported energy use
The developer’s Model 3 Performance showed 300 Wh/mi before and 240 Wh/mi after fitting V3 Alpha. That is a single, uncontrolled before-and-after observation; speed, temperature, wind, tires and route were not held constant. It is many times larger than the drag reduction above can explain, so it should not be read as a predicted result. A controlled back-to-back test has not been run yet. The energy calculator uses the reported figures as its defaults because they are the only on-car measurement available, and lets you enter your own.
6Limitations
- The drag change moved with the mesh (+16.6, −15.2 and −7.2 N on the three DDES meshes); a finer mesh could move it again.
- The DDES window covers about 3.4 vehicle lengths of flow; longer windows would tighten the statistics.
- Zero yaw only. Crosswind, rotating wheels, cooling flow and ride-height changes were not modeled.
- On the two steady mesh levels the spoiler surface carries no prism layers; its edges are resolved at about 1 mm.
- No physical validation (wind tunnel, coastdown or controlled energy test) has been completed yet.
7Conclusions
- On the finest mesh (17.23M cells, DDES), V3 Alpha adds 110 ± 11 N of rear downforce at 80 mph and lowers drag by 7 ± 3 N (2%).
- Every data set, steady and transient, shows less rear lift with the spoiler.
- The drag reduction is small and mesh-sensitive: negative in four of five data sets, positive only on the coarsest DDES mesh.
- The load on the rear glass and deck converged between the two finer DDES meshes.
- The exoskeleton airfoil with a 0.7 mm single wall gives a calculated mass of about 225 g.
- V3 Beta, the same airfoil without plates, gives −119.2 ± 12.2 N rear-axle lift and −9.6 ± 2.3 N drag on the finest mesh: a tie with V3 Alpha.
- On-car energy effects need a controlled test before they can be stated as performance.
AAppendix: effort tally
Running count of the Tesla Model 3 spoiler CFD program as of October 28, 2026. Counts are lower bounds.
| CFD solver runs | 249 (156 longer than 10 minutes) |
| Solver iterations and time steps | 438,164 |
| steady iterations | 179,567 |
| transient time steps | 258,597 |
| Meshes built | 245 |
| Solver time, CPU-equivalent | ≈665 h |
| CPU-equivalent core-hours | ≈9,100 |
References
- OpenCFD Ltd., OpenFOAM v2506 User Guide, 2025.
- Menter, F. R., “Two-Equation Eddy-Viscosity Turbulence Models for Engineering Applications,” AIAA Journal 32(8):1598–1605, 1994.
- Spalart, P. R., Deck, S., Shur, M. L., Squires, K. D., Strelets, M. Kh., and Travin, A., “A New Version of Detached-eddy Simulation, Resistant to Ambiguous Grid Densities,” Theoretical and Computational Fluid Dynamics 20:181–195, 2006.
- Gritskevich, M. S., Garbaruk, A. V., Schütze, J., and Menter, F. R., “Development of DDES and IDDES Formulations for the k-ω Shear Stress Transport Model,” Flow, Turbulence and Combustion 88:431–449, 2012.
- Hucho, W.-H. (ed.), Aerodynamics of Road Vehicles, 4th ed., SAE International, 1998.
Definitions
- CD, CL
- Drag and lift coefficients on Aref = 2.202 m² at 35.76 m/s.
- CL,front, CL,rear
- Lift split about the front and rear axles. Negative values are downforce.
- RANS
- Reynolds-averaged Navier-Stokes, steady.
- DDES
- Delayed detached-eddy simulation, transient.
- Wh/mi
- Watt-hours per mile.